Get the last value of every sensor
There are several ways to get the latest value of every sensor. The following examples use the structure defined in [Narrow table format example][setup-a-narrow-table-format] as a reference:
- [SELECT DISTINCT ON][select-distinct-on]
- [JOIN LATERAL][join-lateral]
SELECT DISTINCT ON
If you have a list of sensors, the easy way to get the latest value of every sensor is to use SELECT DISTINCT ON:
The common table expression (CTE) used above is not strictly necessary. However, it is an elegant way to join to the sensor list to get a sensor name in the output. If this is not something you care about, you can leave it out:
It is important to take care when down-selecting this data. In the previous examples, the time that the query would scan back was limited. However, if there any sensors that have either not reported in a long time or in the worst case, never reported, this query devolves to a full table scan. In a database with 1000+ sensors and 41 million rows, an unconstrained query takes over an hour.
An alternative to [SELECT DISTINCT ON][select-distinct-on] is to use a JOIN LATERAL. By selecting your entire sensor list from the sensors table rather than pulling the IDs out using SELECT DISTINCT, JOIN LATERAL can offer some improvements in performance:
Limiting the time range is important, especially if you have a lot of data. Best practice is to use these kinds of queries for dashboards and quick status checks. To query over a much larger time range, encapsulate the previous example into a materialized query that refreshes infrequently, perhaps once a day.
Shoutout to Christopher Piggott for this recipe.
===== PAGE: https://docs.tigerdata.com/tutorials/blockchain-query/ =====
Examples:
Example 1 (sql):
CREATE OR REPLACE FUNCTION deduplicate_chunks(ht_name TEXT, partition_columns TEXT, bot_id INT DEFAULT NULL)
    RETURNS TABLE
            (
                chunk_schema  name,
                chunk_name    name,
                deleted_count INT
            )
AS
$$
DECLARE
    chunk         RECORD;
    where_clause  TEXT := '';
    deleted_count INT;
BEGIN
    IF bot_id IS NOT NULL THEN
        where_clause := FORMAT('WHERE bot_id = %s', bot_id);
    END IF;

    FOR chunk IN
        SELECT c.chunk_schema, c.chunk_name
        FROM timescaledb_information.chunks c
        WHERE c.hypertable_name = ht_name
        LOOP
            EXECUTE FORMAT('
            WITH cte AS (
                SELECT ctid,
                       ROW_NUMBER() OVER (PARTITION BY %s ORDER BY %s ASC) AS row_num,
                       *
                FROM %I.%I
                %s
            )
            DELETE FROM %I.%I
            WHERE ctid IN (
                SELECT ctid
                FROM cte
                WHERE row_num > 1
            )
            RETURNING 1;
        ', partition_columns, partition_columns, chunk.chunk_schema, chunk.chunk_name, where_clause, chunk.chunk_schema,
                           chunk.chunk_name)
                INTO deleted_count;

            RETURN QUERY SELECT chunk.chunk_schema, chunk.chunk_name, COALESCE(deleted_count, 0);
        END LOOP;
END
$$ LANGUAGE plpgsql;

SELECT *
FROM deduplicate_chunks('nudge_events', 'bot_id, session_id, nudge_id, time', 2540);
Example 2 (sql):
SELECT timestamp,
      FROM hypertable as h
      JOIN related_table as rt
        ON rt.id = h.related_table_id
     WHERE h.timestamp BETWEEN '2024-10-10 00:00:00' AND '2024-10-17 00:00:00'
Example 3 (sql):
WITH cached_query AS materialized (
  SELECT *
    FROM hypertable
   WHERE BETWEEN '2024-10-10 00:00:00' AND '2024-10-17 00:00:00'
)
  SELECT *
    FROM cached_query as c
    JOIN related_table as rt
      ON rt.id = h.related_table_id
Example 4 (sql):
CONSTRAINT at_least_one_not_null
        CHECK ((d IS NOT NULL) OR (i IS NOT NULL) OR (b IS NOT NULL) OR (j IS NOT NULL) OR (t IS NOT NULL))
Telemetry and version checking
URL: llms-txt#telemetry-and-version-checking
Contents:
- Change what is included the telemetry report
- Version checking
- Disable telemetry
- Disabling telemetry
- Enabling telemetry
TimescaleDB collects anonymous usage data to help us better understand and assist our users. It also helps us provide some services, such as automated version checking. Your privacy is the most important thing to us, so we do not collect any personally identifying information. In particular, the UUID (user ID) fields contain no identifying information, but are randomly generated by appropriately seeded random number generators.
This is an example of the JSON data file that is sent for a specific deployment:
If you want to see the exact JSON data file that is sent, use the [get_telemetry_report][get_telemetry_report] API call.
Telemetry reports are different if you are using an open source or community version of TimescaleDB. For these versions, the report includes an edition field, with a value of either apache_only or community.
Change what is included the telemetry report
If you want to adjust which metadata is included or excluded from the telemetry report, you can do so in the _timescaledb_catalog.metadata table. Metadata which has include_in_telemetry set to true, and a value of timescaledb_telemetry.cloud, is included in the telemetry report.
Telemetry reports are sent periodically in the background. In response to the telemetry report, the database receives the most recent version of TimescaleDB available for installation. This version is recorded in your server logs, along with any applicable out-of-date version warnings. You do not have to update immediately to the newest release, but we highly recommend that you do so, to take advantage of performance improvements and bug fixes.
It is highly recommend that you leave telemetry enabled, as it provides useful features for you, and helps to keep improving Timescale. However, you can turn off telemetry if you need to for a specific database, or for an entire instance.
If you turn off telemetry, the version checking feature is also turned off.
Disabling telemetry
Open your Postgres configuration file, and locate the
timescaledb.telemetry_levelparameter. See the [Postgres configuration file][postgres-config] instructions for locating and opening the file.Change the parameter setting to
off:Reload the configuration file:
Alternatively, you can use this command at the
psqlprompt, as the root user:
This command disables telemetry for the specified system, database, or user.
Enabling telemetry
Open your Postgres configuration file, and locate the 'timescaledb.telemetry_level' parameter. See the [Postgres configuration file][postgres-config] instructions for locating and opening the file.
Change the parameter setting to 'off':
Reload the configuration file:
Alternatively, you can use this command at the
psqlprompt, as the root user:
This command enables telemetry for the specified system, database, or user.
===== PAGE: https://docs.tigerdata.com/self-hosted/configuration/timescaledb-tune/ =====
Examples:
Example 1 (json):
{
  "db_uuid": "860c2be4-59a3-43b5-b895-5d9e0dd44551",
  "license": {
    "edition": "community"
  },
  "os_name": "Linux",
  "relations": {
    "views": {
      "num_relations": 0
    },
    "tables": {
      "heap_size": 32768,
      "toast_size": 16384,
      "indexes_size": 98304,
      "num_relations": 4,
      "num_reltuples": 12
    },
    "hypertables": {
      "heap_size": 3522560,
      "toast_size": 23379968,
      "compression": {
        "compressed_heap_size": 3522560,
        "compressed_row_count": 4392,
        "compressed_toast_size": 20365312,
        "num_compressed_chunks": 366,
        "uncompressed_heap_size": 41951232,
        "uncompressed_row_count": 421368,
        "compressed_indexes_size": 11993088,
        "uncompressed_toast_size": 2998272,
        "uncompressed_indexes_size": 42696704,
        "num_compressed_hypertables": 1
      },
      "indexes_size": 18022400,
      "num_children": 366,
      "num_relations": 2,
      "num_reltuples": 421368
    },
    "materialized_views": {
      "heap_size": 0,
      "toast_size": 0,
      "indexes_size": 0,
      "num_relations": 0,
      "num_reltuples": 0
    },
    "partitioned_tables": {
      "heap_size": 0,
      "toast_size": 0,
      "indexes_size": 0,
      "num_children": 0,
      "num_relations": 0,
      "num_reltuples": 0
    },
    "continuous_aggregates": {
      "heap_size": 122404864,
      "toast_size": 6225920,
      "compression": {
        "compressed_heap_size": 0,
        "compressed_row_count": 0,
        "num_compressed_caggs": 0,
        "compressed_toast_size": 0,
        "num_compressed_chunks": 0,
        "uncompressed_heap_size": 0,
        "uncompressed_row_count": 0,
        "compressed_indexes_size": 0,
        "uncompressed_toast_size": 0,
        "uncompressed_indexes_size": 0
      },
      "indexes_size": 165044224,
      "num_children": 760,
      "num_relations": 24,
      "num_reltuples": 914704,
      "num_caggs_on_distributed_hypertables": 0,
      "num_caggs_using_real_time_aggregation": 24
    },
    "distributed_hypertables_data_node": {
      "heap_size": 0,
      "toast_size": 0,
      "compression": {
        "compressed_heap_size": 0,
        "compressed_row_count": 0,
        "compressed_toast_size": 0,
        "num_compressed_chunks": 0,
        "uncompressed_heap_size": 0,
        "uncompressed_row_count": 0,
        "compressed_indexes_size": 0,
        "uncompressed_toast_size": 0,
        "uncompressed_indexes_size": 0,
        "num_compressed_hypertables": 0
      },
      "indexes_size": 0,
      "num_children": 0,
      "num_relations": 0,
      "num_reltuples": 0
    },
    "distributed_hypertables_access_node": {
      "heap_size": 0,
      "toast_size": 0,
      "compression": {
        "compressed_heap_size": 0,
        "compressed_row_count": 0,
        "compressed_toast_size": 0,
        "num_compressed_chunks": 0,
        "uncompressed_heap_size": 0,
        "uncompressed_row_count": 0,
        "compressed_indexes_size": 0,
        "uncompressed_toast_size": 0,
        "uncompressed_indexes_size": 0,
        "num_compressed_hypertables": 0
      },
      "indexes_size": 0,
      "num_children": 0,
      "num_relations": 0,
      "num_reltuples": 0,
      "num_replica_chunks": 0,
      "num_replicated_distributed_hypertables": 0
    }
  },
  "os_release": "5.10.47-linuxkit",
  "os_version": "#1 SMP Sat Jul 3 21:51:47 UTC 2021",
  "data_volume": 381903727,
  "db_metadata": {},
  "build_os_name": "Linux",
  "functions_used": {
    "pg_catalog.int8(integer)": 8,
    "pg_catalog.count(pg_catalog.\"any\")": 20,
    "pg_catalog.int4eq(integer,integer)": 7,
    "pg_catalog.textcat(pg_catalog.text,pg_catalog.text)": 10,
    "pg_catalog.chareq(pg_catalog.\"char\",pg_catalog.\"char\")": 6,
  },
  "install_method": "docker",
  "installed_time": "2022-02-17T19:55:14+00",
  "os_name_pretty": "Alpine Linux v3.15",
  "last_tuned_time": "2022-02-17T19:55:14Z",
  "build_os_version": "5.11.0-1028-azure",
  "exported_db_uuid": "5730161f-0d18-42fb-a800-45df33494c21",
  "telemetry_version": 2,
  "build_architecture": "x86_64",
  "distributed_member": "none",
  "last_tuned_version": "0.12.0",
  "postgresql_version": "12.10",
  "related_extensions": {
    "postgis": false,
    "pg_prometheus": false,
    "timescale_analytics": false,
    "timescaledb_toolkit": false
  },
  "timescaledb_version": "2.6.0",
  "num_reorder_policies": 0,
  "num_retention_policies": 0,
  "num_compression_policies": 1,
  "num_user_defined_actions": 1,
  "build_architecture_bit_size": 64,
  "num_continuous_aggs_policies": 24
}
Example 2 (yaml):
timescaledb.telemetry_level=offExample 3 (bash):
pg_ctlExample 4 (sql):
ALTER [SYSTEM | DATABASE | USER] { *db_name* | *role_specification* } SET timescaledb.telemetry_level=offUse Tiger Data products
URL: llms-txt#use-tiger-data-products
This section contains information about using TimescaleDB and Tiger Cloud. If you're not sure how to find the information you need, try the [Find a docs page][find-docs] section.
===== PAGE: https://docs.tigerdata.com/use-timescale/OLD-cloud-multi-node/ =====
attach_data_node()
URL: llms-txt#attach_data_node()
Contents:
- Required arguments
- Optional arguments
- Returns
- Sample usage
[Multi-node support is sunsetted][multi-node-deprecation].
TimescaleDB v2.13 is the last release that includes multi-node support for Postgres versions 13, 14, and 15.
Attach a data node to a hypertable. The data node should have been previously created using [add_data_node][add_data_node].
When a distributed hypertable is created, by default it uses all available data nodes for the hypertable, but if a data node is added after a hypertable is created, the data node is not automatically used by existing distributed hypertables.
If you want a hypertable to use a data node that was created later, you must attach the data node to the hypertable using this function.
Required arguments
| Name | Description |
|---|---|
node_name | Name of data node to attach |
hypertable | Name of distributed hypertable to attach node to |
Optional arguments
| Name | Description |
|---|---|
if_not_attached | Prevents error if the data node is already attached to the hypertable. A notice is printed that the data node is attached. Defaults to FALSE. |
repartition | Change the partitioning configuration so that all the attached data nodes are used. Defaults to TRUE. |
| Column | Description |
|---|---|
hypertable_id | Hypertable id of the modified hypertable |
node_hypertable_id | Hypertable id on the remote data node |
node_name | Name of the attached data node |
Attach a data node dn3 to a distributed hypertable conditions previously created with [create_distributed_hypertable][create_distributed_hypertable].
You must add a data node to your distributed database first with add_data_node first before attaching it.
===== PAGE: https://docs.tigerdata.com/api/distributed-hypertables/set_number_partitions/ =====
Examples:
Example 1 (sql):
SELECT * FROM attach_data_node('dn3','conditions');

hypertable_id | node_hypertable_id |  node_name
--------------+--------------------+-------------
            5 |                  3 | dn3

(1 row)
Export metrics to Datadog
URL: llms-txt#export-metrics-to-datadog
Contents:
- Prerequisites
- Create a data exporter
- Manage a data exporter
- Attach a data exporter to a Tiger Cloud service
- Monitor Tiger Cloud service metrics
- Edit a data exporter
- Delete a data exporter
- Reference
You can export telemetry data from your Tiger Cloud services with the time-series and analytics capability enabled to [Datadog][datadog]. The available metrics include CPU usage, RAM usage, and storage. This integration is available for [Scale or Enterprise][pricing-plan-features] pricing plans.
This page shows you how to create a Datadog exporter in Tiger Cloud Console, and manage the lifecycle of data exporters.
To follow the steps on this page:
- Create a target [Tiger Cloud service][create-service] with real-time analytics enabled.
Create a data exporter
Tiger Cloud data exporters send telemetry data from a Tiger Cloud service to third-party monitoring tools. You create an exporter on the [project level][projects], in the same AWS region as your service:
- In Tiger Cloud Console, open [Exporters][console-integrations]
- Click
New exporter - Select
MetricsforData typeandDatadogfor provider
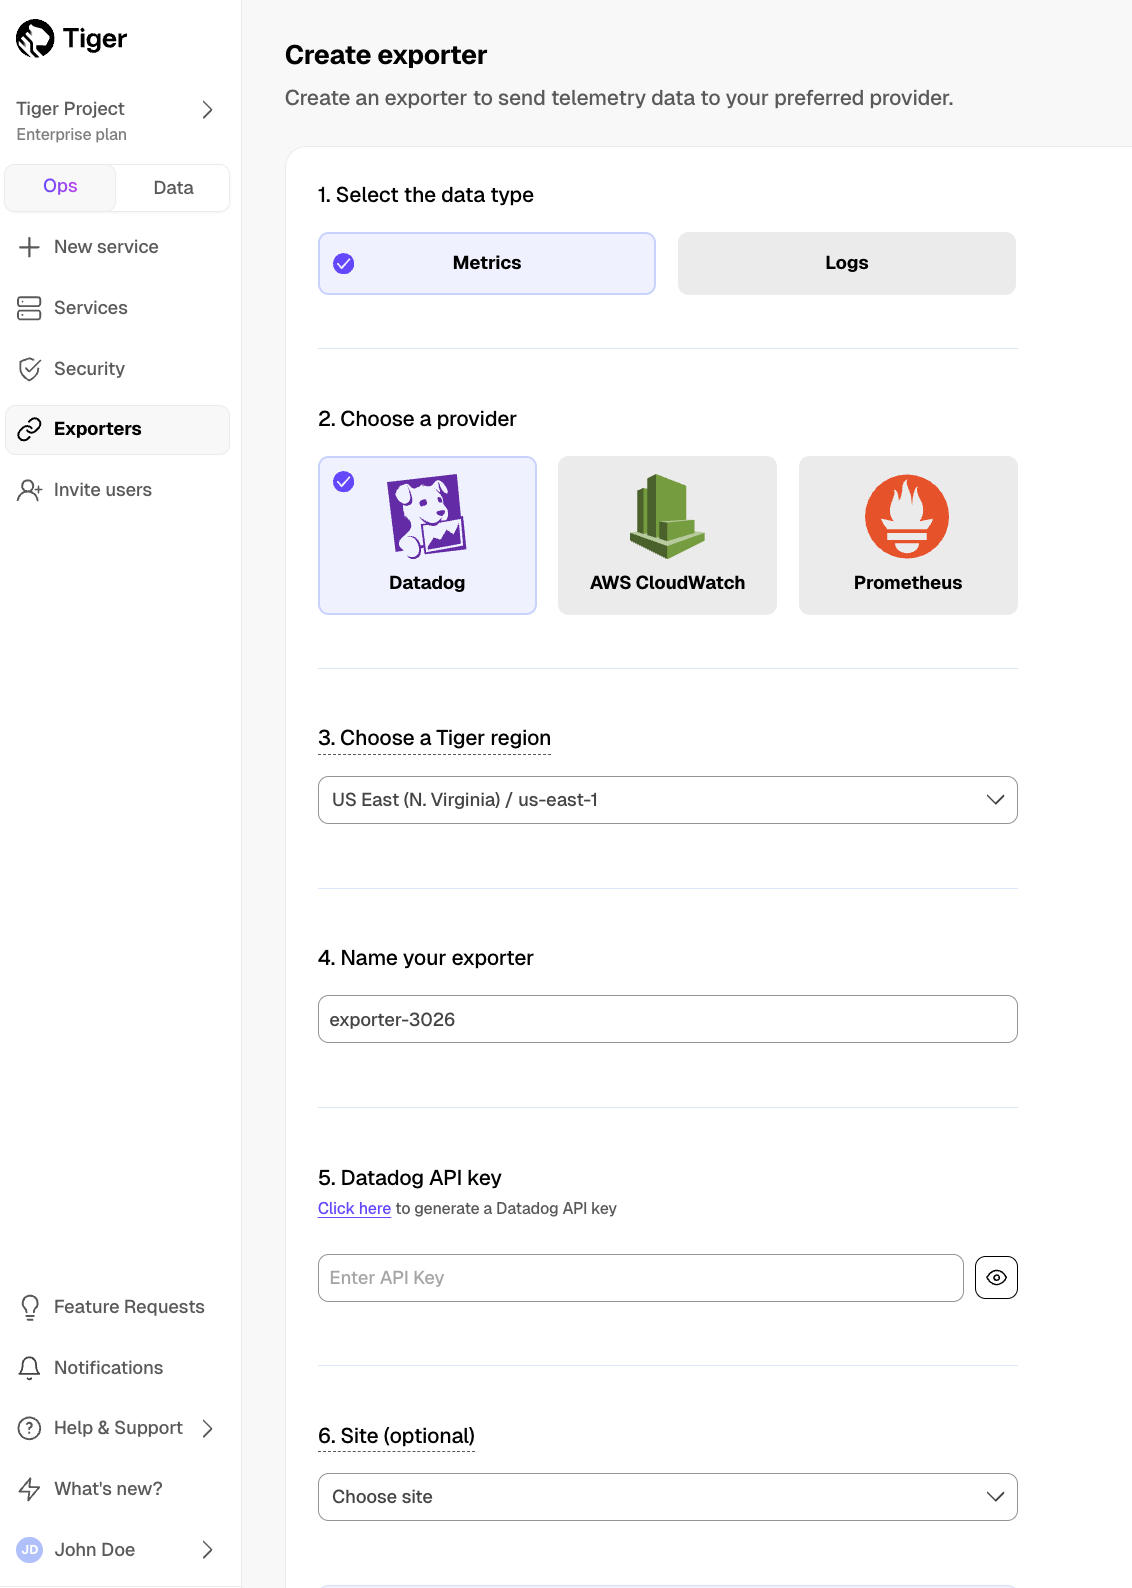
- Choose your AWS region and provide the API key
The AWS region must be the same for your Tiger Cloud exporter and the Datadog provider.
- Set
Siteto your Datadog region, then clickCreate exporter
Manage a data exporter
This section shows you how to attach, monitor, edit, and delete a data exporter.
Attach a data exporter to a Tiger Cloud service
To send telemetry data to an external monitoring tool, you attach a data exporter to your Tiger Cloud service. You can attach only one exporter to a service.
To attach an exporter:
- In [Tiger Cloud Console][console-services], choose the service
- Click
Operations>Exporters - Select the exporter, then click
Attach exporter - If you are attaching a first
Logsdata type exporter, restart the service
Monitor Tiger Cloud service metrics
You can now monitor your service metrics. Use the following metrics to check the service is running correctly:
timescale.cloud.system.cpu.usage.millicorestimescale.cloud.system.cpu.total.millicorestimescale.cloud.system.memory.usage.bytestimescale.cloud.system.memory.total.bytestimescale.cloud.system.disk.usage.bytestimescale.cloud.system.disk.total.bytes
Additionally, use the following tags to filter your results.
| Tag | Example variable | Description |
|---|---|---|
host | us-east-1.timescale.cloud | |
project-id | ||
service-id | ||
region | us-east-1 | AWS region |
role | replica or primary | For service with replicas |
node-id | For multi-node services |
Edit a data exporter
To update a data exporter:
- In Tiger Cloud Console, open [Exporters][console-integrations]
- Next to the exporter you want to edit, click the menu >
Edit - Edit the exporter fields and save your changes
You cannot change fields such as the provider or the AWS region.
Delete a data exporter
To remove a data exporter that you no longer need:
Disconnect the data exporter from your Tiger Cloud services
In [Tiger Cloud Console][console-services], choose the service.
- Click
Operations>Exporters. - Click the trash can icon.
- Repeat for every service attached to the exporter you want to remove.
- Click
The data exporter is now unattached from all services. However, it still exists in your project.
Delete the exporter on the project level
In Tiger Cloud Console, open [Exporters][console-integrations]
- Next to the exporter you want to edit, click menu >
Delete - Confirm that you want to delete the data exporter.
- Next to the exporter you want to edit, click menu >
When you create the IAM OIDC provider, the URL must match the region you create the exporter in. It must be one of the following:
| Region | Zone | Location | URL |
|---|---|---|---|
ap-southeast-1 | Asia Pacific | Singapore | irsa-oidc-discovery-prod-ap-southeast-1.s3.ap-southeast-1.amazonaws.com |
ap-southeast-2 | Asia Pacific | Sydney | irsa-oidc-discovery-prod-ap-southeast-2.s3.ap-southeast-2.amazonaws.com |
ap-northeast-1 | Asia Pacific | Tokyo | irsa-oidc-discovery-prod-ap-northeast-1.s3.ap-northeast-1.amazonaws.com |
ca-central-1 | Canada | Central | irsa-oidc-discovery-prod-ca-central-1.s3.ca-central-1.amazonaws.com |
eu-central-1 | Europe | Frankfurt | irsa-oidc-discovery-prod-eu-central-1.s3.eu-central-1.amazonaws.com |
eu-west-1 | Europe | Ireland | irsa-oidc-discovery-prod-eu-west-1.s3.eu-west-1.amazonaws.com |
eu-west-2 | Europe | London | irsa-oidc-discovery-prod-eu-west-2.s3.eu-west-2.amazonaws.com |
sa-east-1 | South America | São Paulo | irsa-oidc-discovery-prod-sa-east-1.s3.sa-east-1.amazonaws.com |
us-east-1 | United States | North Virginia | irsa-oidc-discovery-prod.s3.us-east-1.amazonaws.com |
us-east-2 | United States | Ohio | irsa-oidc-discovery-prod-us-east-2.s3.us-east-2.amazonaws.com |
us-west-2 | United States | Oregon | irsa-oidc-discovery-prod-us-west-2.s3.us-west-2.amazonaws.com |
===== PAGE: https://docs.tigerdata.com/use-timescale/metrics-logging/metrics-to-prometheus/ =====
month_normalize()
URL: llms-txt#month_normalize()
Contents:
- Samples
- Required arguments
Translate a metric to a standard month. A standard month is calculated as the exact number of days in a year divided by the number of months in a year, so 365.25/12 = 30.4375. month_normalize() divides a metric by the number of days in the corresponding calendar month and multiplies it by 30.4375.
This enables you to compare metrics for different months and decide which one performed better, objectively. For example, in the following table that summarizes the number of sales for three months, January has the highest number of total sales:
| Month | Sales |
|---|---|
| Jan | 3000 |
| Feb | 2900 |
| Mar | 2900 |
When you normalize the sales metrics, you get the following result, showing that February in fact performed better:
| Month | Normalized sales |
|---|---|
| Jan | 2945.56 |
| Feb | 3152.46 |
| Mar | 2847.38 |
Get the normalized value for a metric of 1000, and a reference date of January 1, 2021:
The output looks like this:
Required arguments
| Name | Type | Description |
|---|---|---|
metric | float8 | |
reference_date | TIMESTAMPTZ | Timestamp to normalize the metric with |
days | float8 | Optional, defaults to 365.25/12 if none provided |
===== PAGE: https://docs.tigerdata.com/api/gauge_agg/ =====
Examples:
Example 1 (sql):
SELECT month_normalize(1000,'2021-01-01 00:00:00+03'::timestamptz)Example 2 (sql):
month_normalize
----------------------
981.8548387096774
"DevOps as code with Tiger"
URL: llms-txt#"devops-as-code-with-tiger"
Contents:
- Prerequisites
- Install and configure Tiger CLI
- Create your first Tiger Cloud service
- Commands
- Global flags
- Configuration parameters
- Prerequisites
- Configure secure authentication
- Create your first Tiger Cloud service
- Security best practices
Tiger Data supplies a clean, programmatic control layer for Tiger Cloud. This includes RESTful APIs and CLI commands that enable humans, machines, and AI agents easily provision, configure, and manage Tiger Cloud services programmatically.
Tiger CLI is a command-line interface that you use to manage Tiger Cloud resources including VPCs, services, read replicas, and related infrastructure. Tiger CLI calls Tiger REST API to communicate with Tiger Cloud.
This page shows you how to install and set up secure authentication for Tiger CLI, then create your first service.
To follow the steps on this page:
- Create a target [Tiger Data account][create-account].
Install and configure Tiger CLI
- Install Tiger CLI
Use the terminal to install the CLI:
Set up API credentials
Log Tiger CLI into your Tiger Data account:
Tiger CLI opens Console in your browser. Log in, then click Authorize.
You can have a maximum of 10 active client credentials. If you get an error, open [credentials][rest-api-credentials] and delete an unused credential.
- Select a Tiger Cloud project:
If only one project is associated with your account, this step is not shown.
Where possible, Tiger CLI stores your authentication information in the system keychain/credential manager. If that fails, the credentials are stored in ~/.config/tiger/credentials with restricted file permissions (600). By default, Tiger CLI stores your configuration in ~/.config/tiger/config.yaml.
- Test your authenticated connection to Tiger Cloud by listing services
This call returns something like: - No services:
- One or more services:
Create your first Tiger Cloud service
Create a new Tiger Cloud service using Tiger CLI:
- Submit a service creation request
By default, Tiger CLI creates a service for you that matches your [pricing plan][pricing-plans]:
- Free plan: shared CPU/memory and the
time-seriesandaicapabilities - Paid plan: 0.5 CPU and 2 GB memory with the
time-seriescapability
Tiger Cloud creates a Development environment for you. That is, no delete protection, high-availability, spooling or read replication. You see something like:
This service is set as default by the CLI.
Check the CLI configuration
You see something like:
And that is it, you are ready to use Tiger CLI to manage your services in Tiger Cloud.
You can use the following commands with Tiger CLI. For more information on each command, use the -h flag. For example: tiger auth login -h
| Command | Subcommand | Description |
|---|---|---|
| auth | Manage authentication and credentials for your Tiger Data account | |
| login | Create an authenticated connection to your Tiger Data account | |
| logout | Remove the credentials used to create authenticated connections to Tiger Cloud | |
| status | Show your current authentication status and project ID | |
| version | Show information about the currently installed version of Tiger CLI | |
| config | Manage your Tiger CLI configuration | |
| show | Show the current configuration | |
set <key> <value> | Set a specific value in your configuration. For example, tiger config set debug true | |
unset <key> | Clear the value of a configuration parameter. For example, tiger config unset debug | |
| reset | Reset the configuration to the defaults. This also logs you out from the current Tiger Cloud project | |
| service | Manage the Tiger Cloud services in this project | |
| create | Create a new service in this project. Possible flags are: <ul><li>--name: service name (auto-generated if not provided)</li><li>--addons: addons to enable (time-series, ai, or none for PostgreSQL-only)</li><li>--region: region code where the service will be deployed</li><li>--cpu-memory: CPU/memory allocation combination</li><li>--replicas: number of high-availability replicas</li><li>--no-wait: don't wait for the operation to complete</li><li>--wait-timeout: wait timeout duration (for example, 30m, 1h30m, 90s)</li><li>--no-set-default: don't set this service as the default service</li><li>--with-password: include password in output</li><li>--output, -o: output format (json, yaml, table)</li></ul> Possible cpu-memory combinations are: <ul><li>shared/shared</li><li>0.5 CPU/2 GB</li><li>1 CPU/4 GB</li><li>2 CPU/8 GB</li><li>4 CPU/16 GB</li><li>8 CPU/32 GB</li><li>16 CPU/64 GB</li><li>32 CPU/128 GB</li></ul> |