Optimize revenue potential
Having all this data is great but how do you use it? Monitoring data is useful to check what has happened, but how can you analyse this information to your advantage? This section explains how to create a visualization that shows how you can maximize potential revenue.
Set up your data for geospatial queries
To add geospatial analysis to your ride count visualization, you need geospatial data to work out which trips originated where. As TimescaleDB is compatible with all Postgres extensions, use [PostGIS][postgis] to slice data by time and location.
Connect to your [Tiger Cloud service][in-console-editors] and add the PostGIS extension:
Add geometry columns for pick up and drop off locations:
Convert the latitude and longitude points into geometry coordinates that work with PostGIS:
This updates 10,906,860 rows of data on both columns, it takes a while. Coffee is your friend.
Visualize the area where you can make the most money
In this section you visualize a query that returns rides longer than 5 miles for trips taken within 2 km of Times Square. The data includes the distance travelled and is GROUP BY trip_distance and location so that Grafana can plot the data properly.
This enables you to see where a taxi driver is most likely to pick up a passenger who wants a longer ride, and make more money.
Create a geolocalization dashboard
In Grafana, create a new dashboard that is connected to your Tiger Cloud service data source with a Geomap visualization.
In the
Queriessection, selectCode, then select the Time seriesFormat.
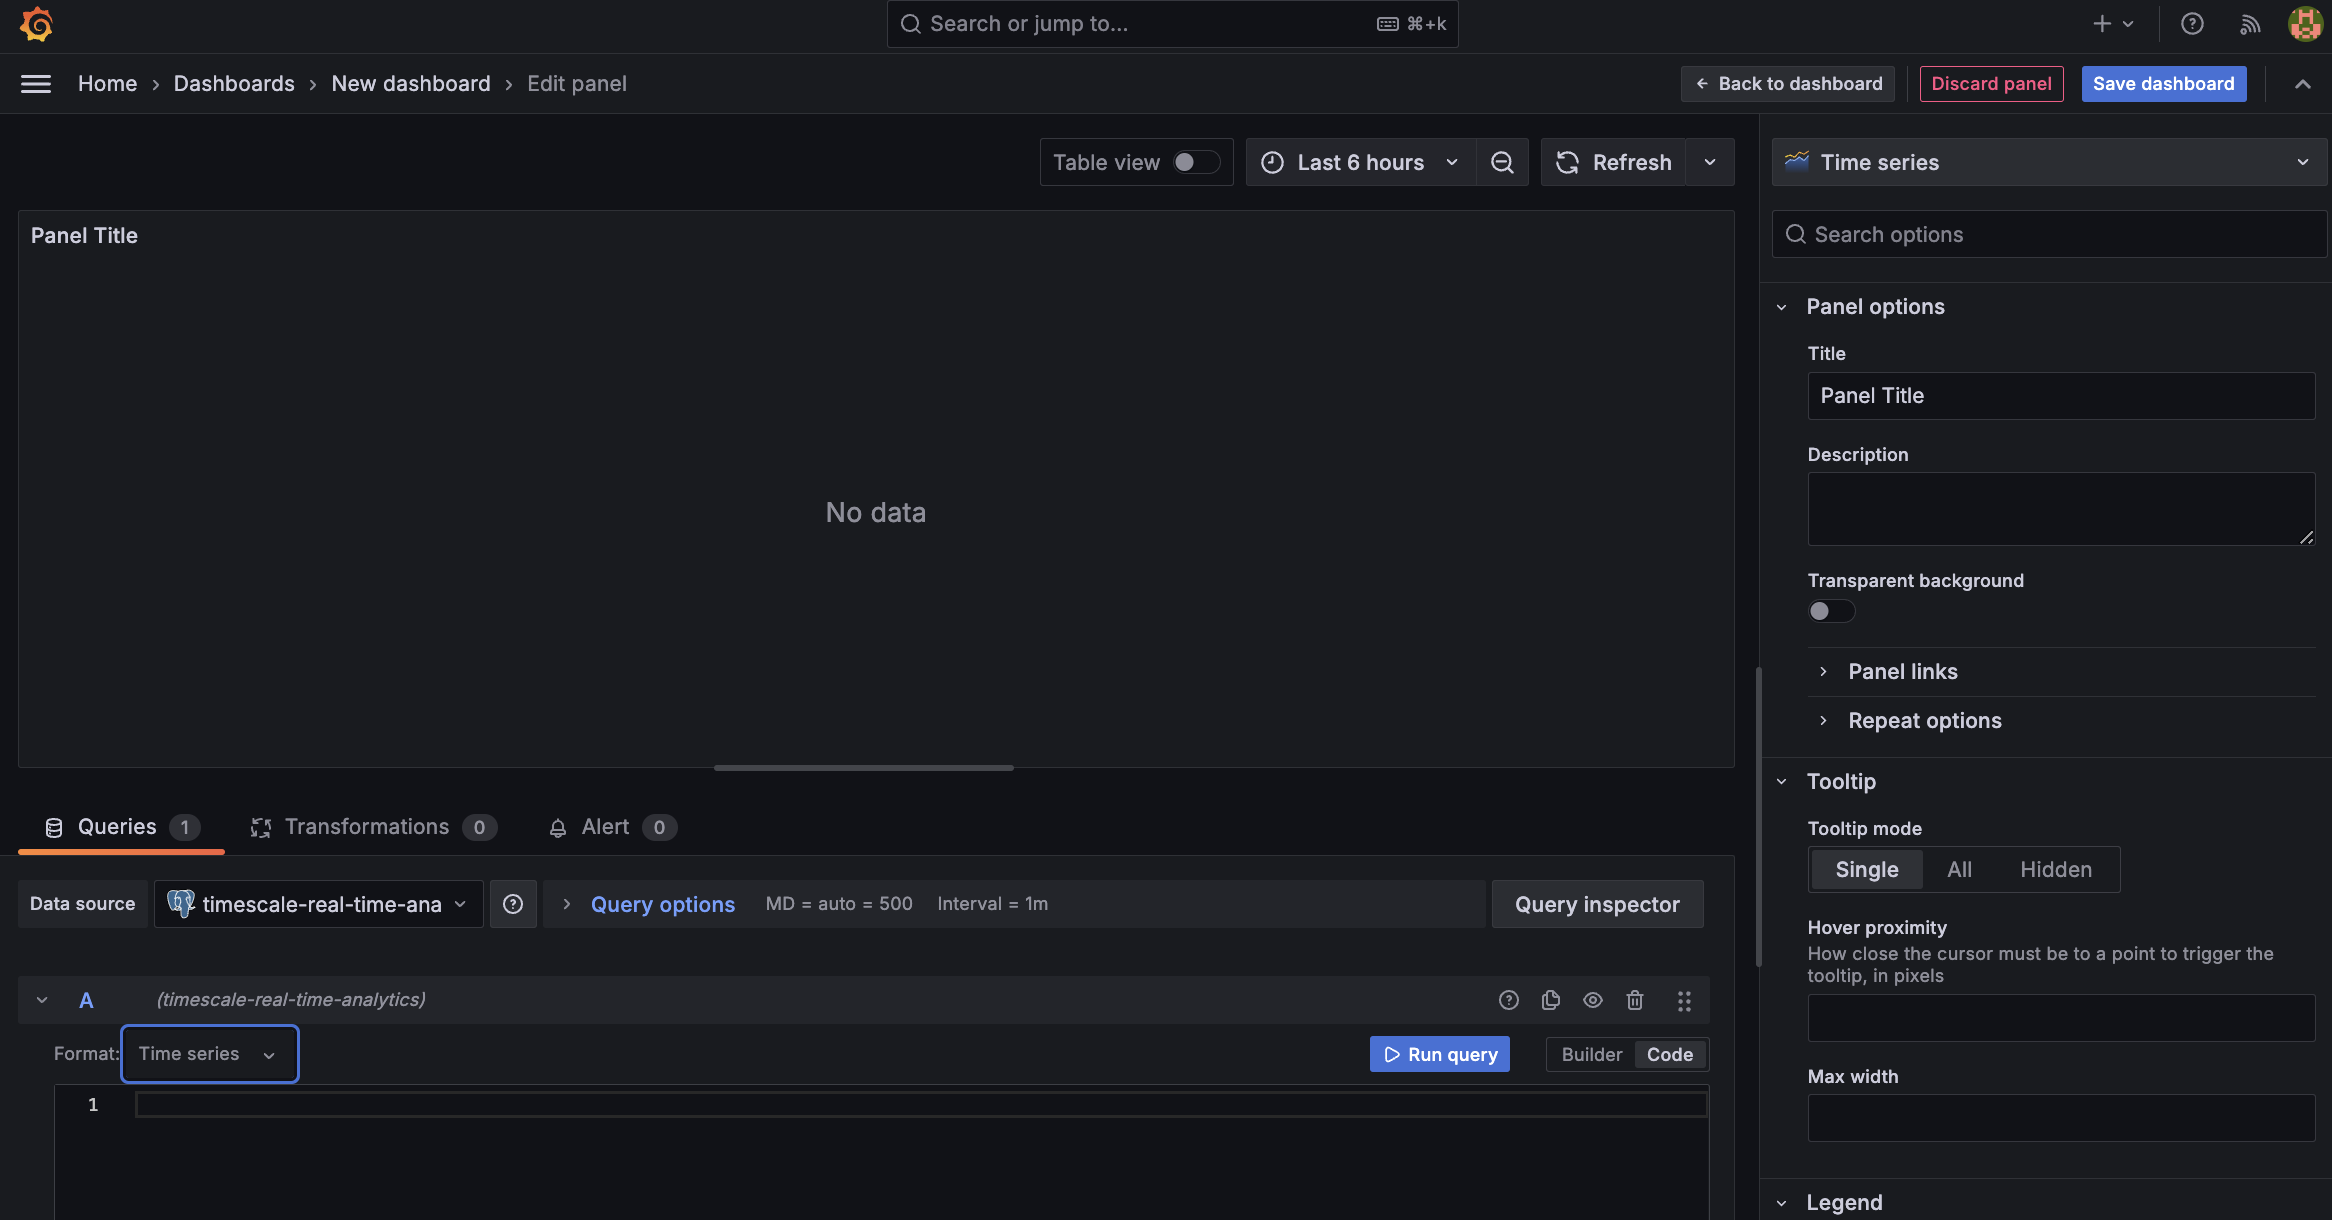
- To find rides longer than 5 miles in Manhattan, paste the following query:
You see a world map with a dot on New York.
Zoom into your map to see the visualization clearly.
Customize the visualization
In the Geomap options, under
Map Layers, click+ Add layerand selectHeatmap. You now see the areas where a taxi driver is most likely to pick up a passenger who wants a longer ride, and make more money.
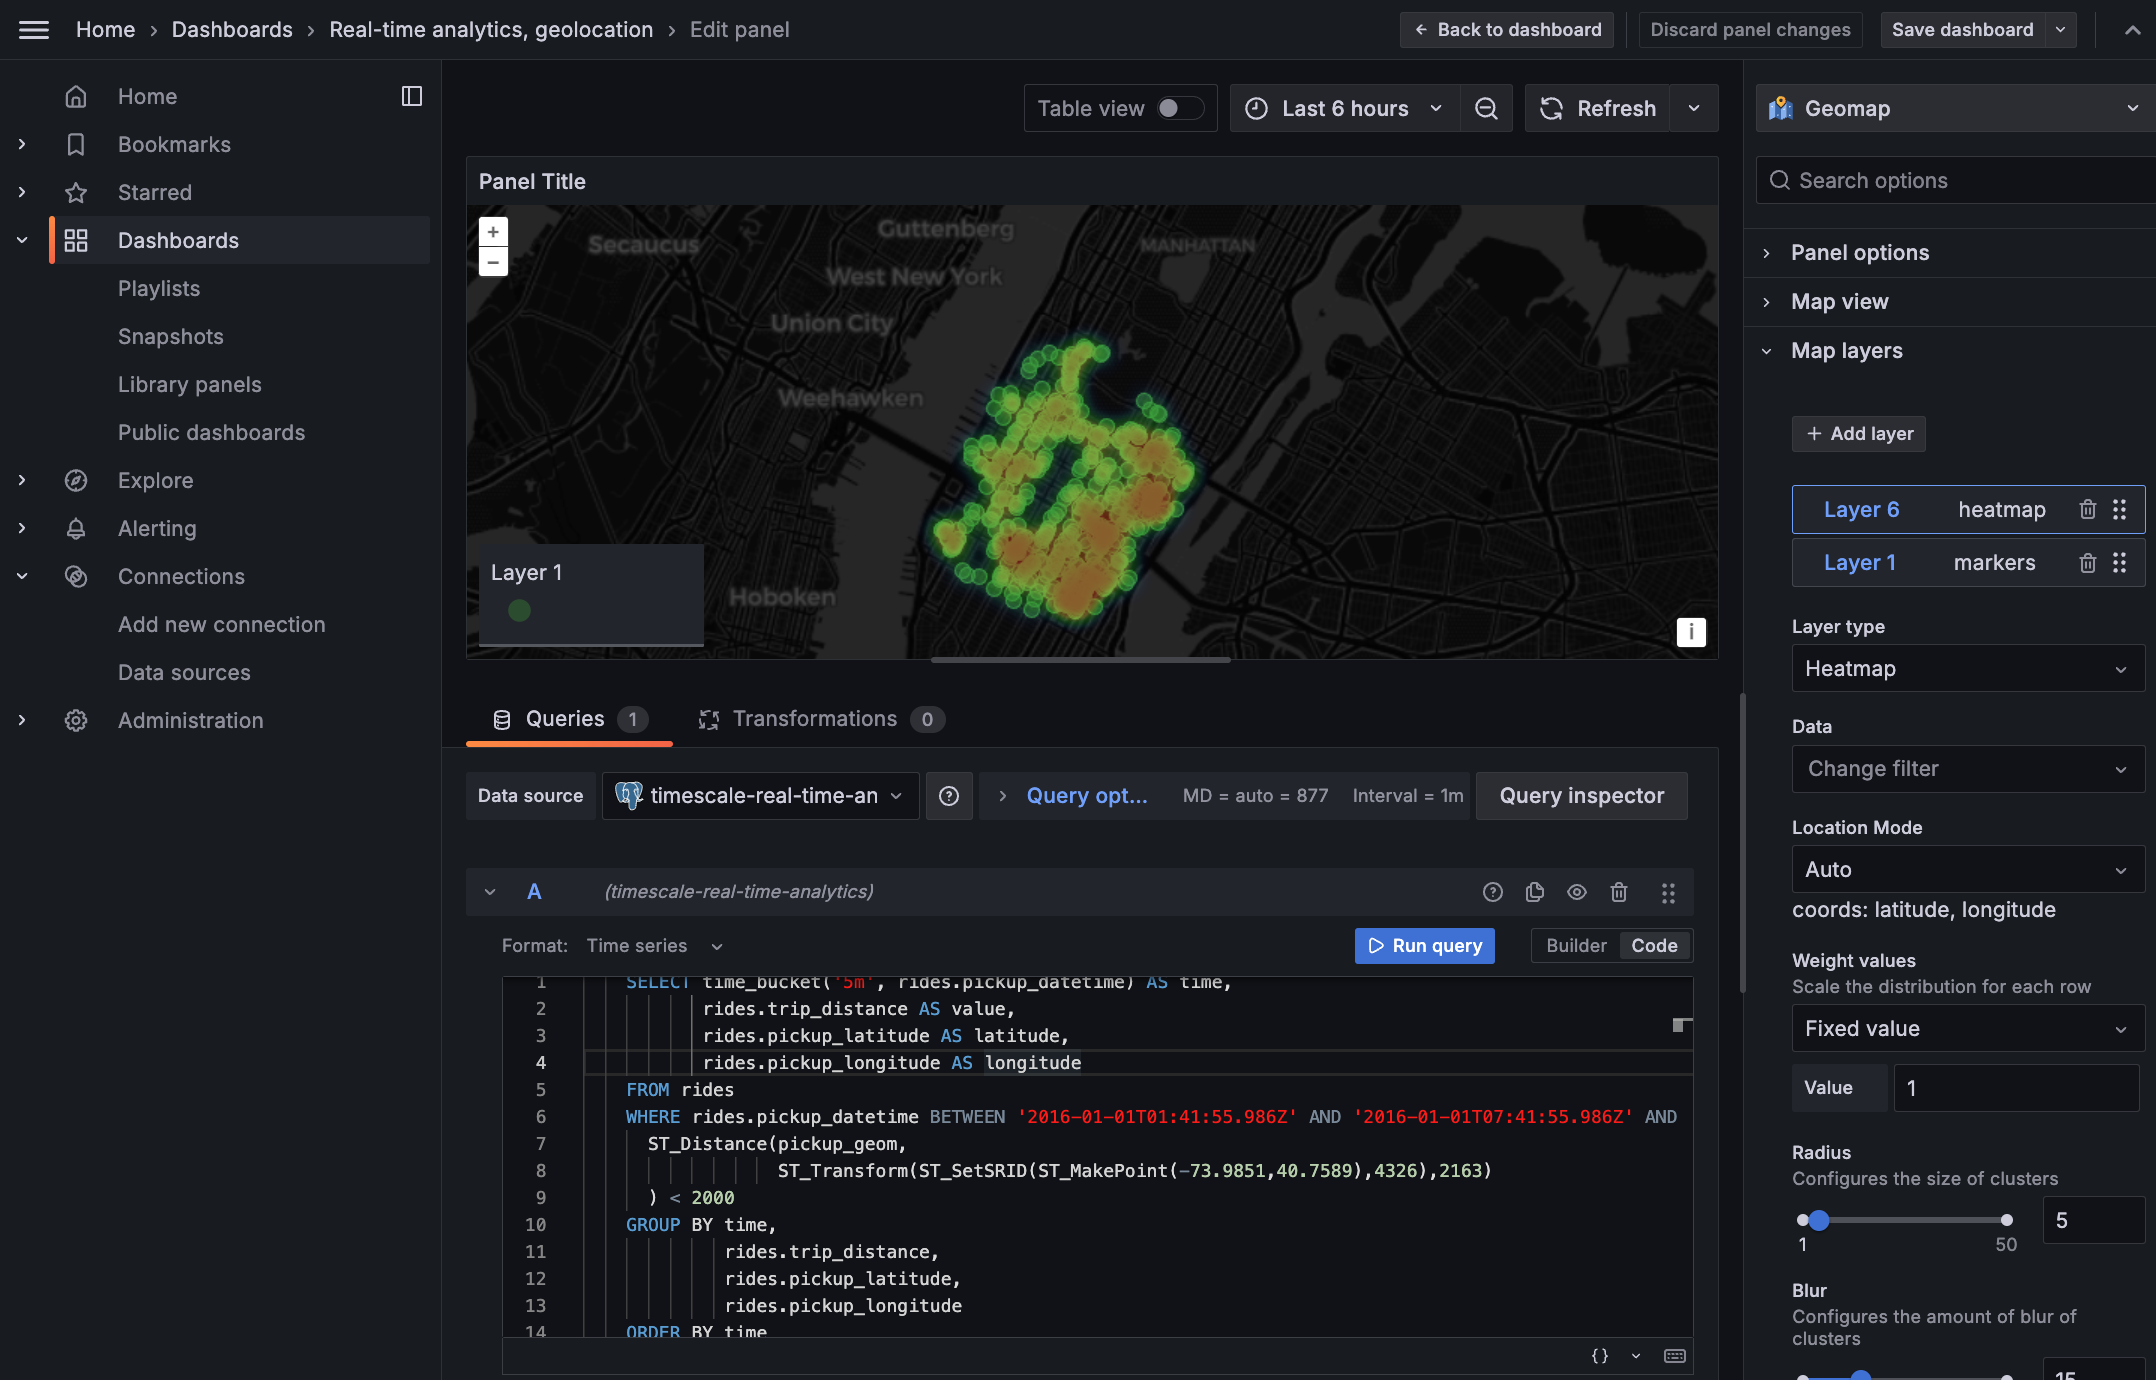
You have integrated Grafana with a Tiger Cloud service and made insights based on visualization of your data.
===== PAGE: https://docs.tigerdata.com/tutorials/real-time-analytics-energy-consumption/ =====
Examples:
Example 1 (bash):