Real-time analytics with Tiger Cloud and Grafana
URL: llms-txt#real-time-analytics-with-tiger-cloud-and-grafana
Contents:
- Prerequisites
- Optimize time-series data in hypertables
- Optimize your data for real-time analytics
- Write fast analytical queries
- Connect Grafana to Tiger Cloud
- Visualize energy consumption
Energy providers understand that customers tend to lose patience when there is not enough power for them to complete day-to-day activities. Task one is keeping the lights on. If you are transitioning to renewable energy, it helps to know when you need to produce energy so you can choose a suitable energy source.
Real-time analytics refers to the process of collecting, analyzing, and interpreting data instantly as it is generated. This approach enables you to track and monitor activity, make the decisions based on real-time insights on data stored in a Tiger Cloud service and keep those lights on.
[Grafana][grafana-docs] is a popular data visualization tool that enables you to create customizable dashboards and effectively monitor your systems and applications.
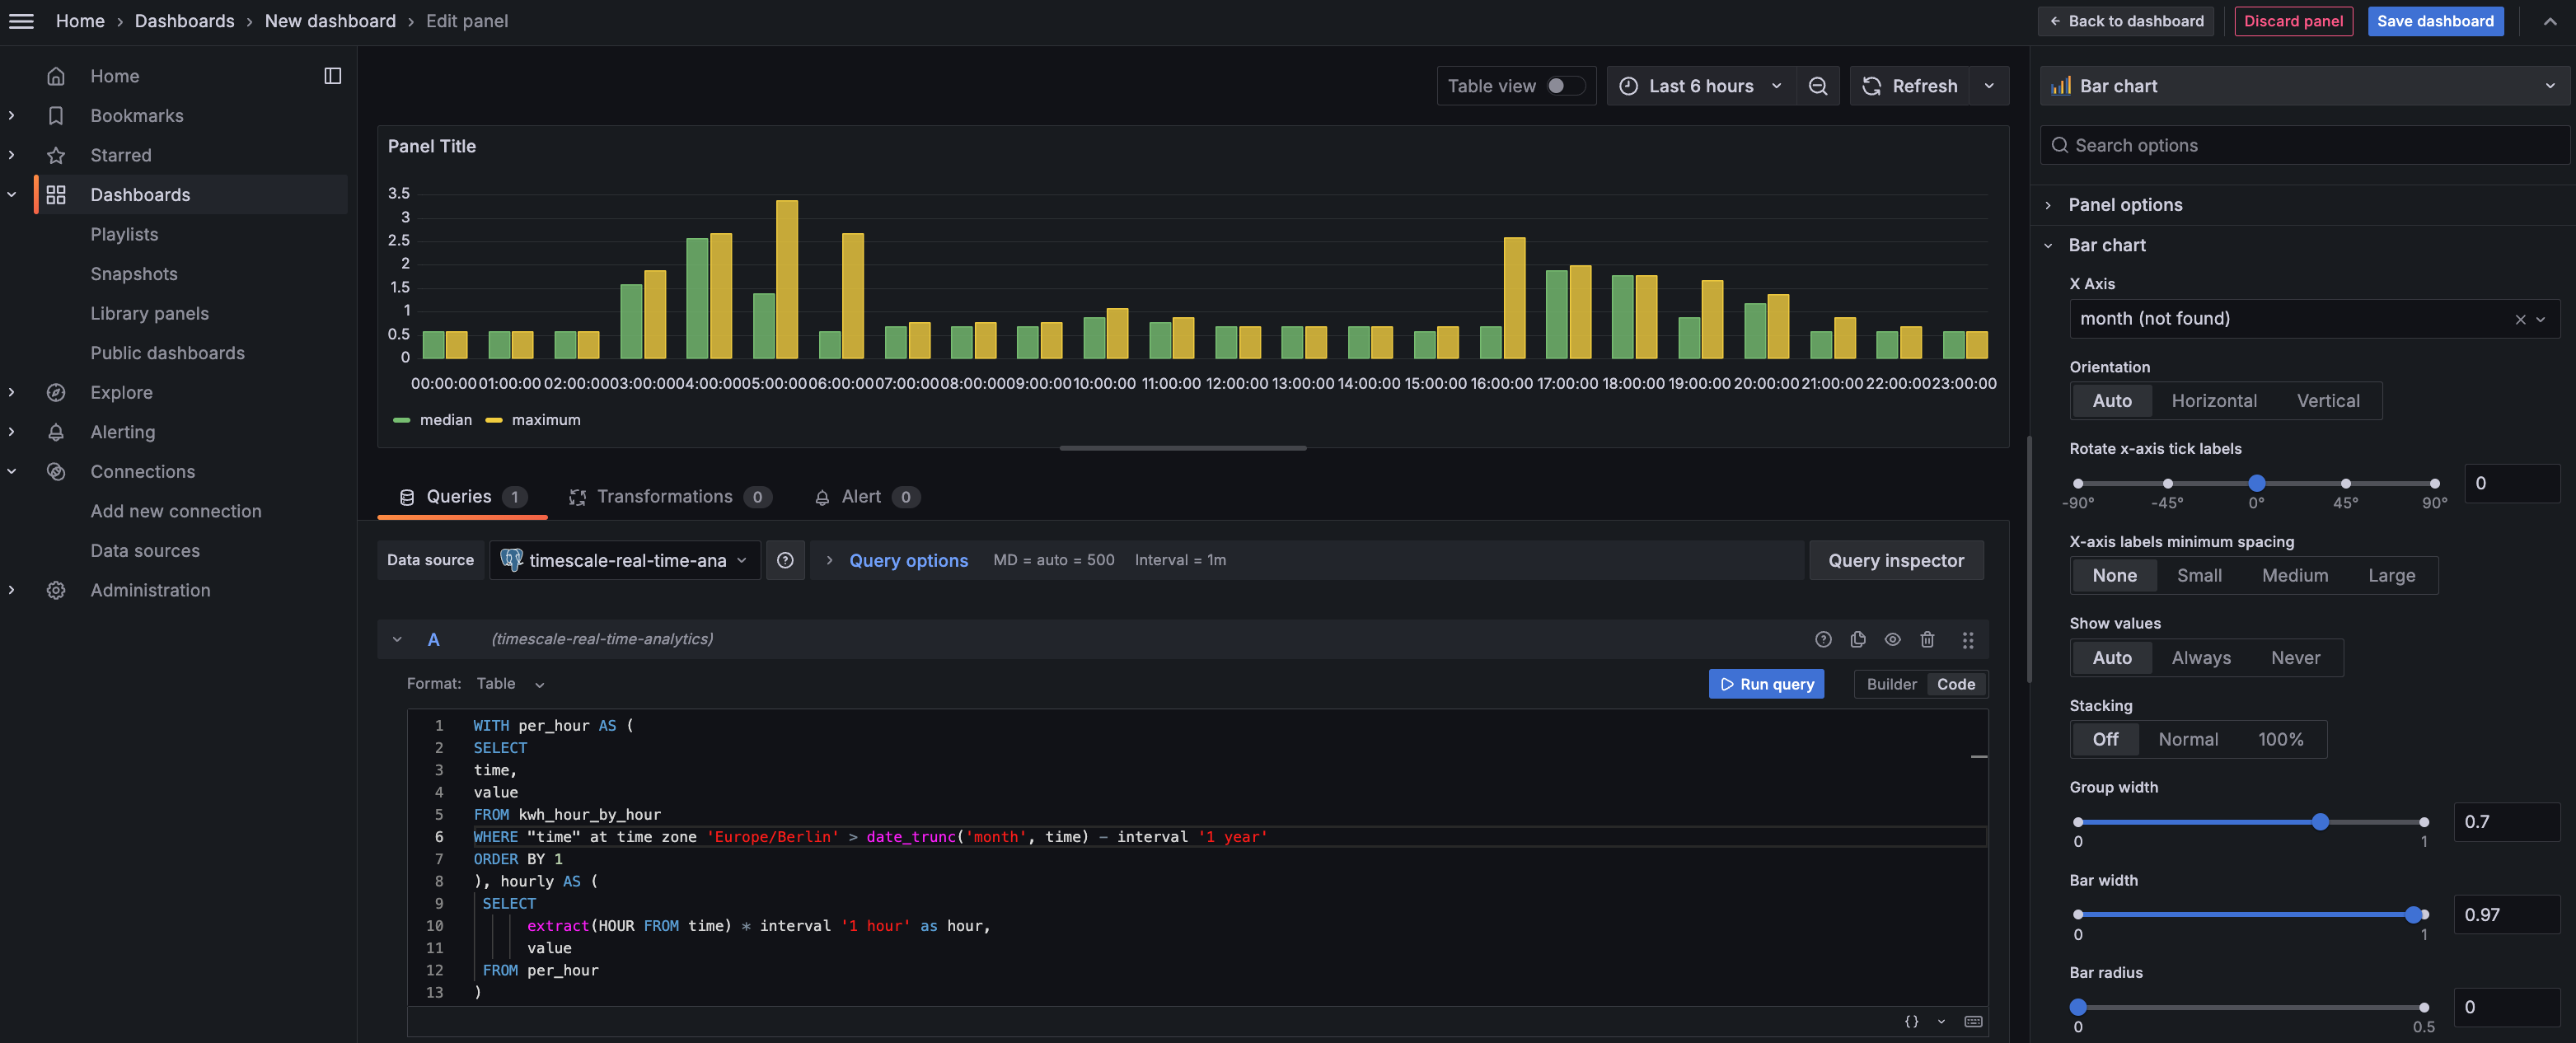
This page shows you how to integrate Grafana with a Tiger Cloud service and make insights based on visualization of data optimized for size and speed in the columnstore.
To follow the steps on this page:
- Create a target [Tiger Cloud service][create-service] with the Real-time analytics capability.
You need [your connection details][connection-info]. This procedure also works for [self-hosted TimescaleDB][enable-timescaledb].
- Install and run [self-managed Grafana][grafana-self-managed], or sign up for [Grafana Cloud][grafana-cloud].