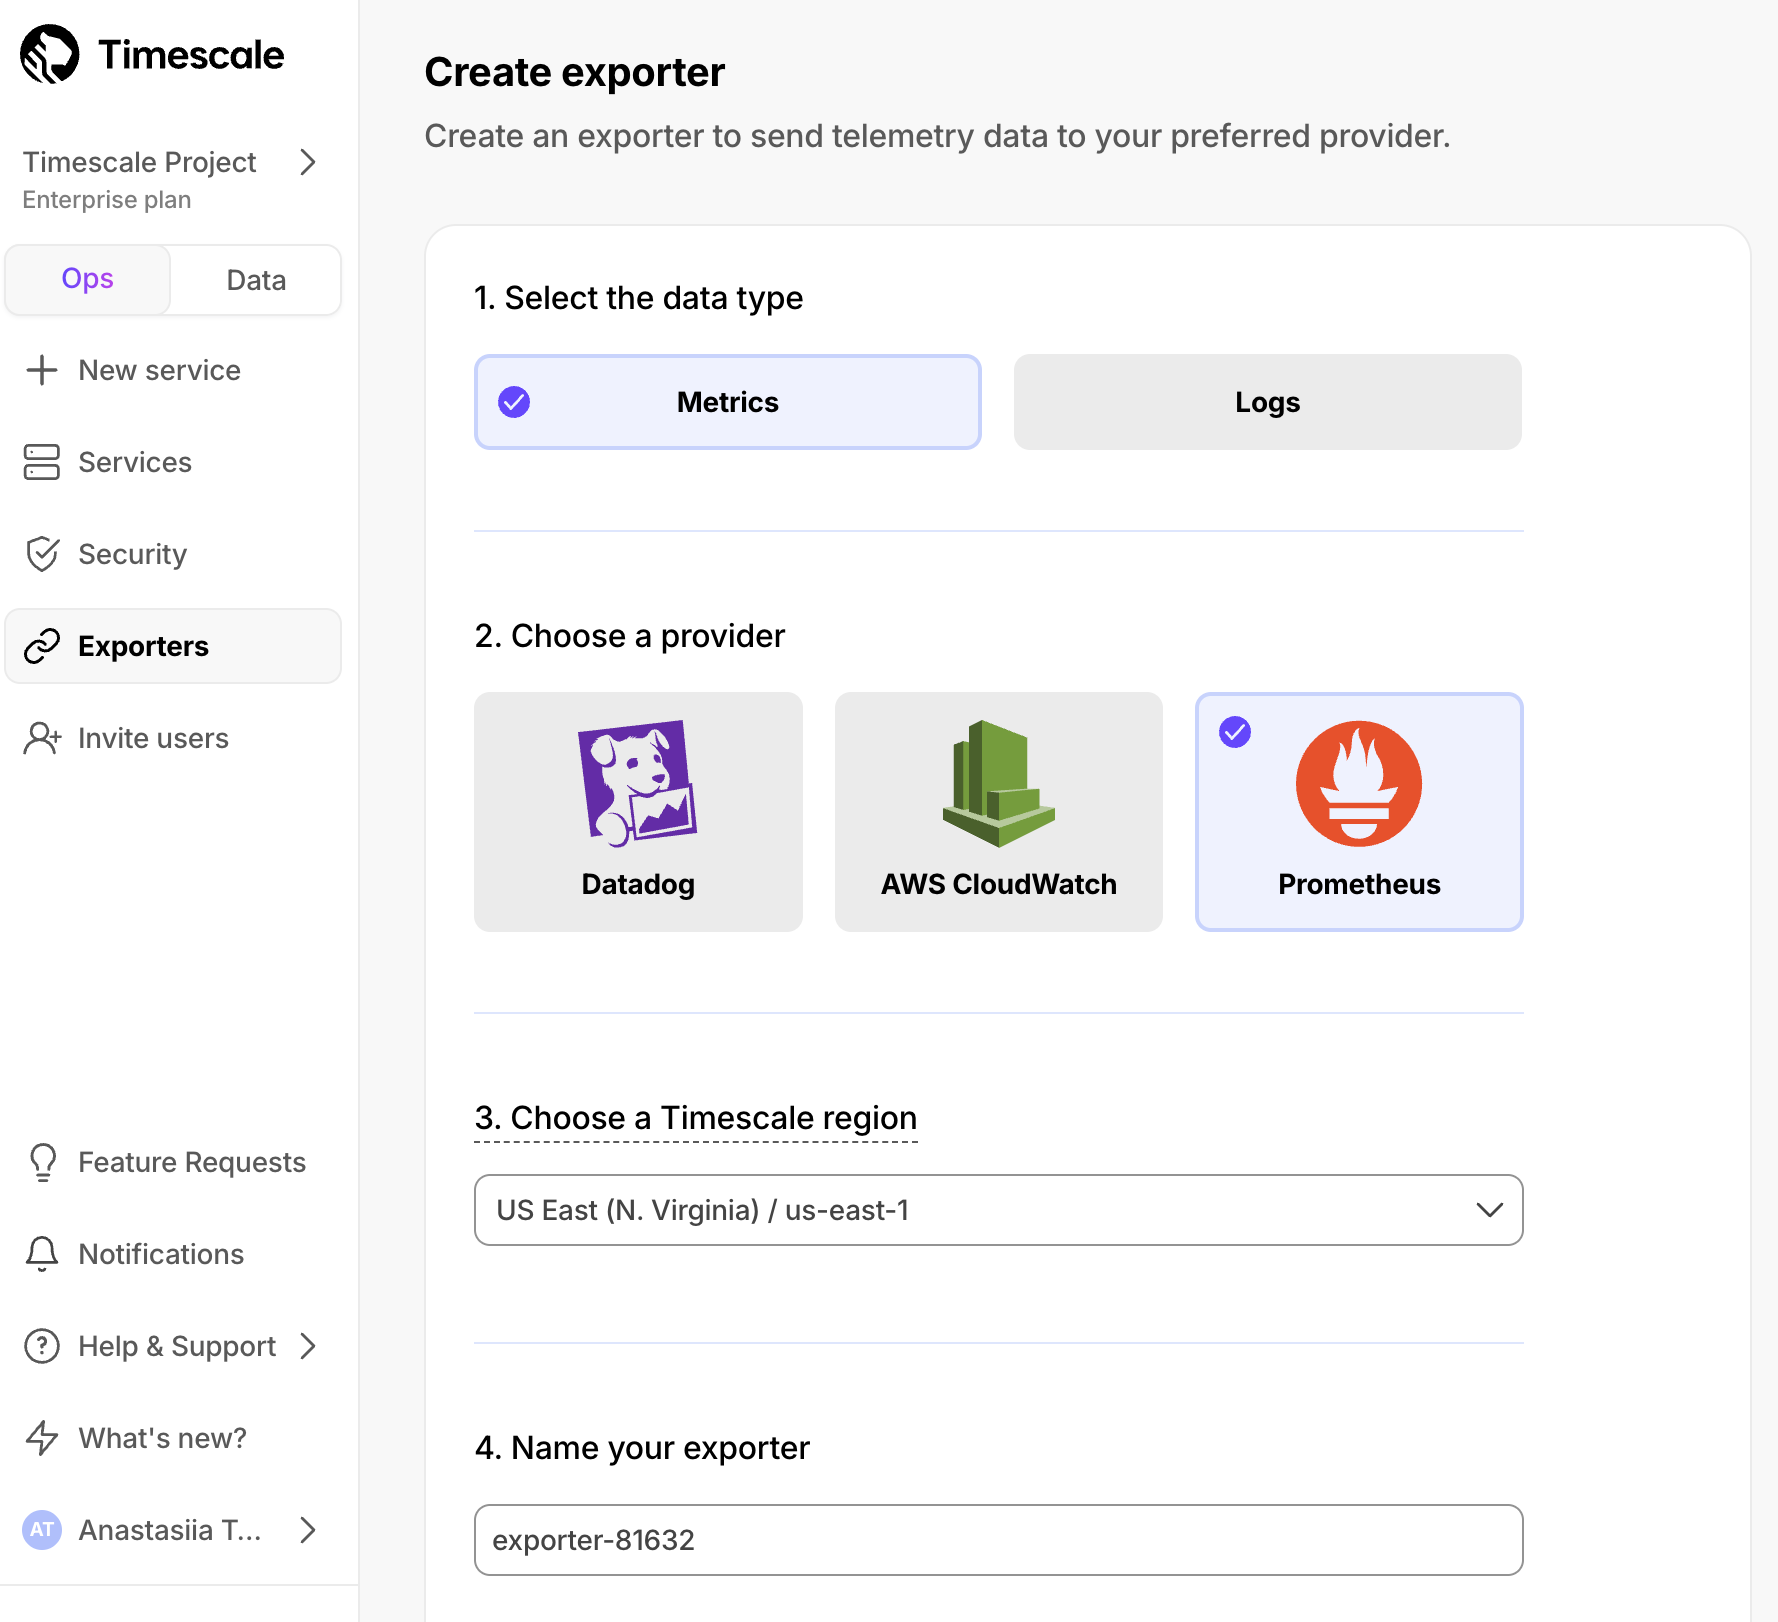
🔥 Ship TimescaleDB metrics to Prometheus
We’re excited to release the Prometheus Exporter for Timescale Cloud, making it easy to ship TimescaleDB metrics to your Prometheus instance. With the Prometheus Exporter, you can:
- Export TimescaleDB metrics like CPU, memory, and storage
- Visualize usage trends with your own Grafana dashboards
- Set alerts for high CPU load, low memory, or storage nearing capacity
To get started, create a Prometheus Exporter in the Timescale Console, attach it to your service, and configure Prometheus to scrape from the exposed URL. Metrics are secured with basic auth. Available on Scale and Enterprise plans. Learn more here.