Monitor performance over time
A Grafana dashboard represents a view into the performance of a system, and each dashboard consists of one or more panels, which represent information about a specific metric related to that system.
To visually monitor the volume of taxi rides over time:
Create the dashboard
On the
Dashboardspage, clickNewand selectNew dashboard.Click
Add visualization.- Select the data source that connects to your Tiger Cloud service. The
Time seriesvisualization is chosen by default.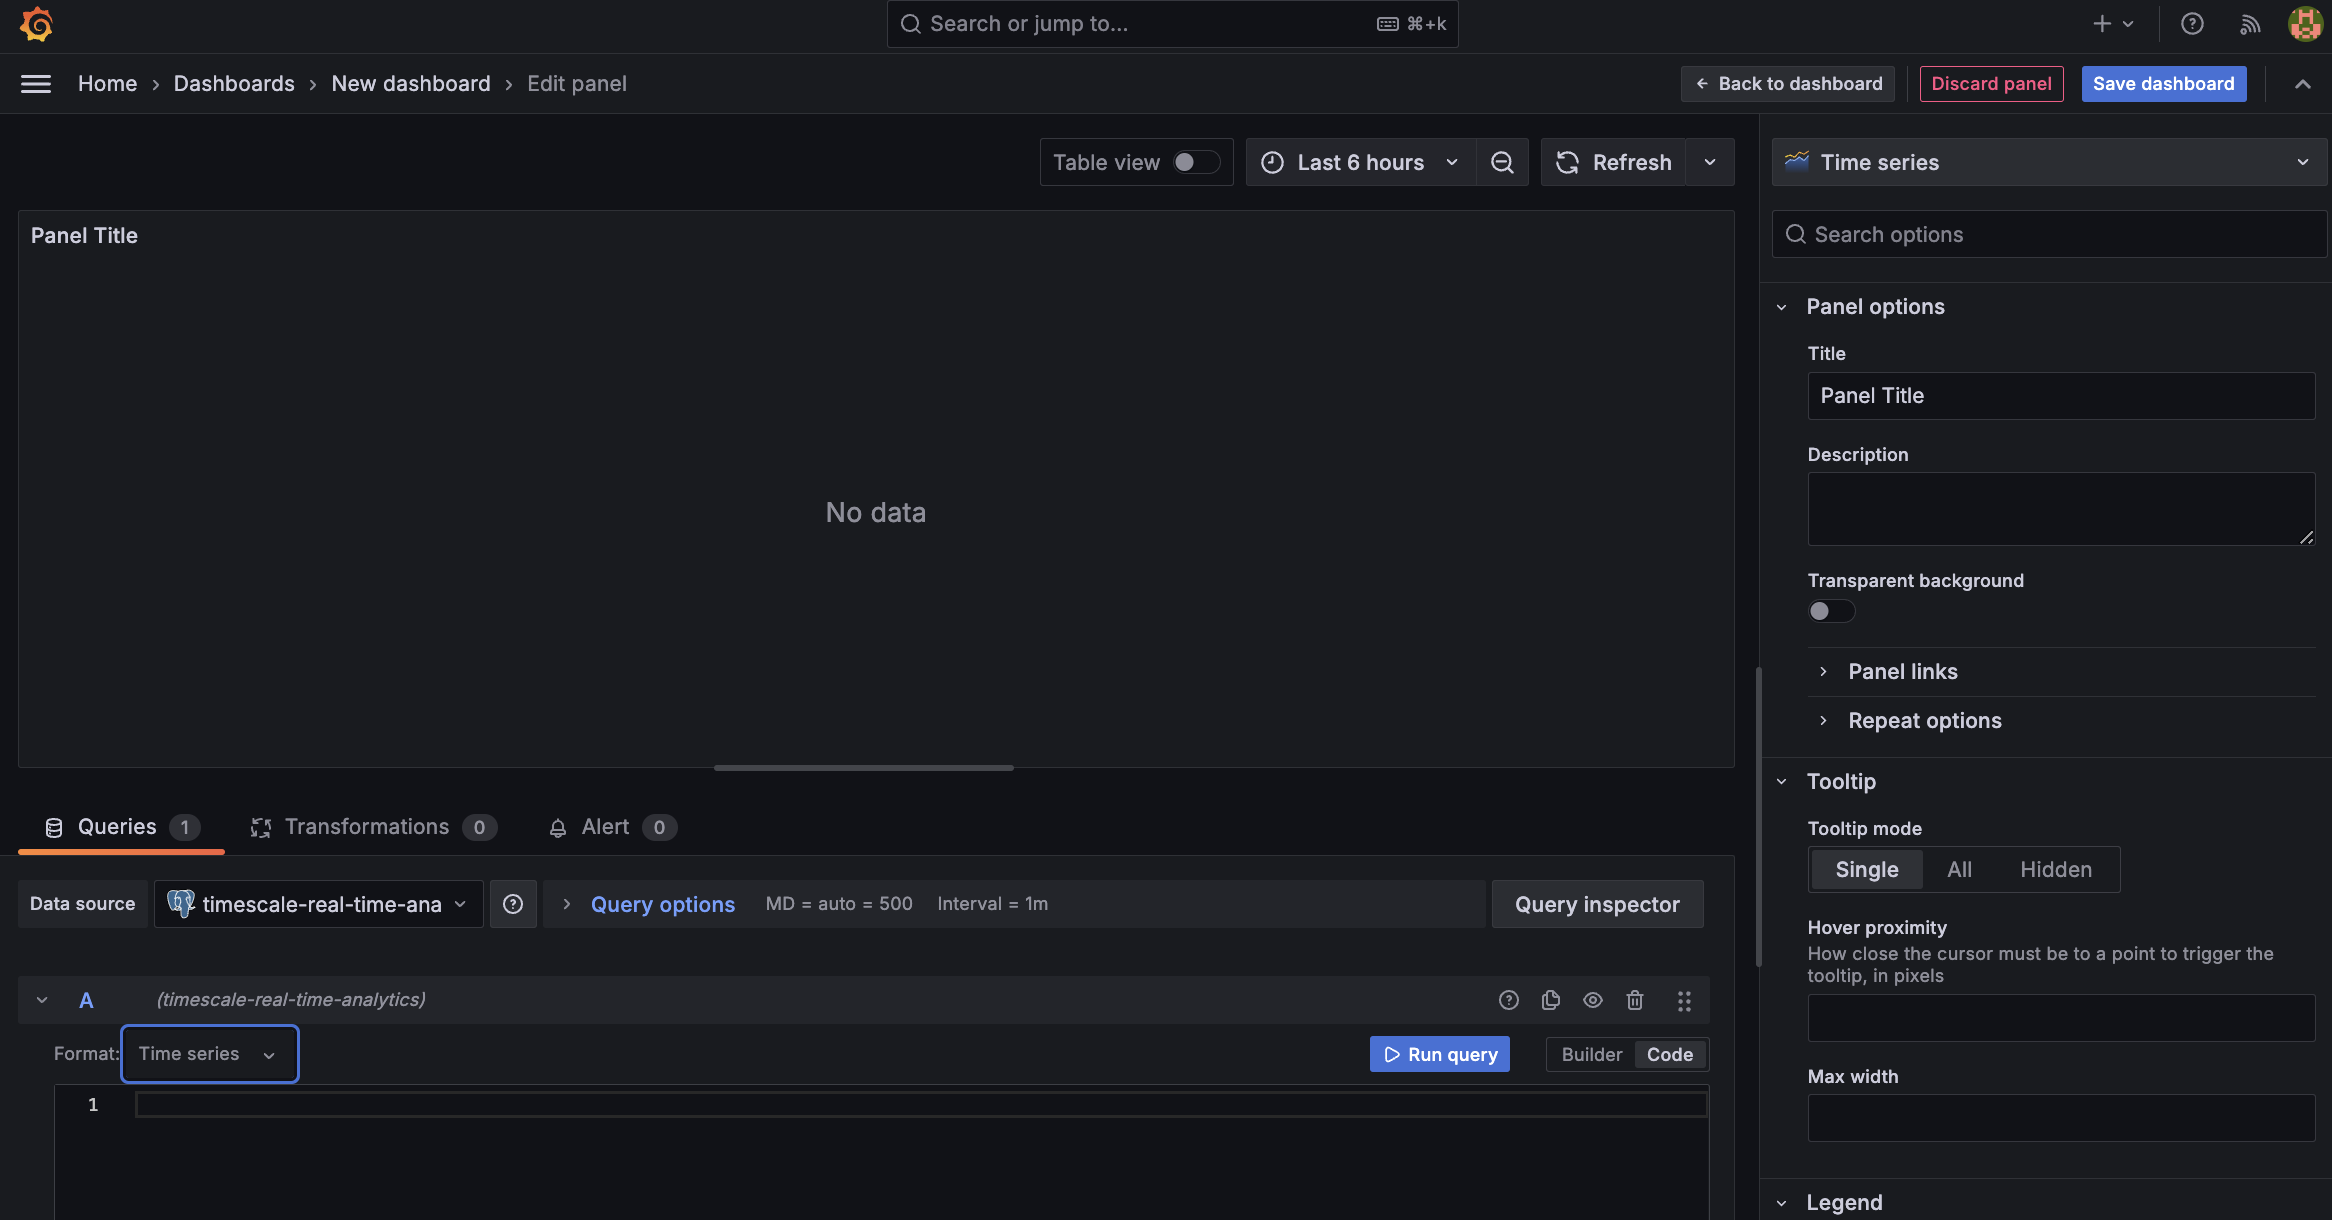
- In the
Queriessection, selectCode, then selectTime seriesinFormat. - Select the data range for your visualization: the data set is from 2016. Click the date range above the panel and set:
- From:
- To:
- Select the data source that connects to your Tiger Cloud service. The
Combine TimescaleDB and Grafana functionality to analyze your data
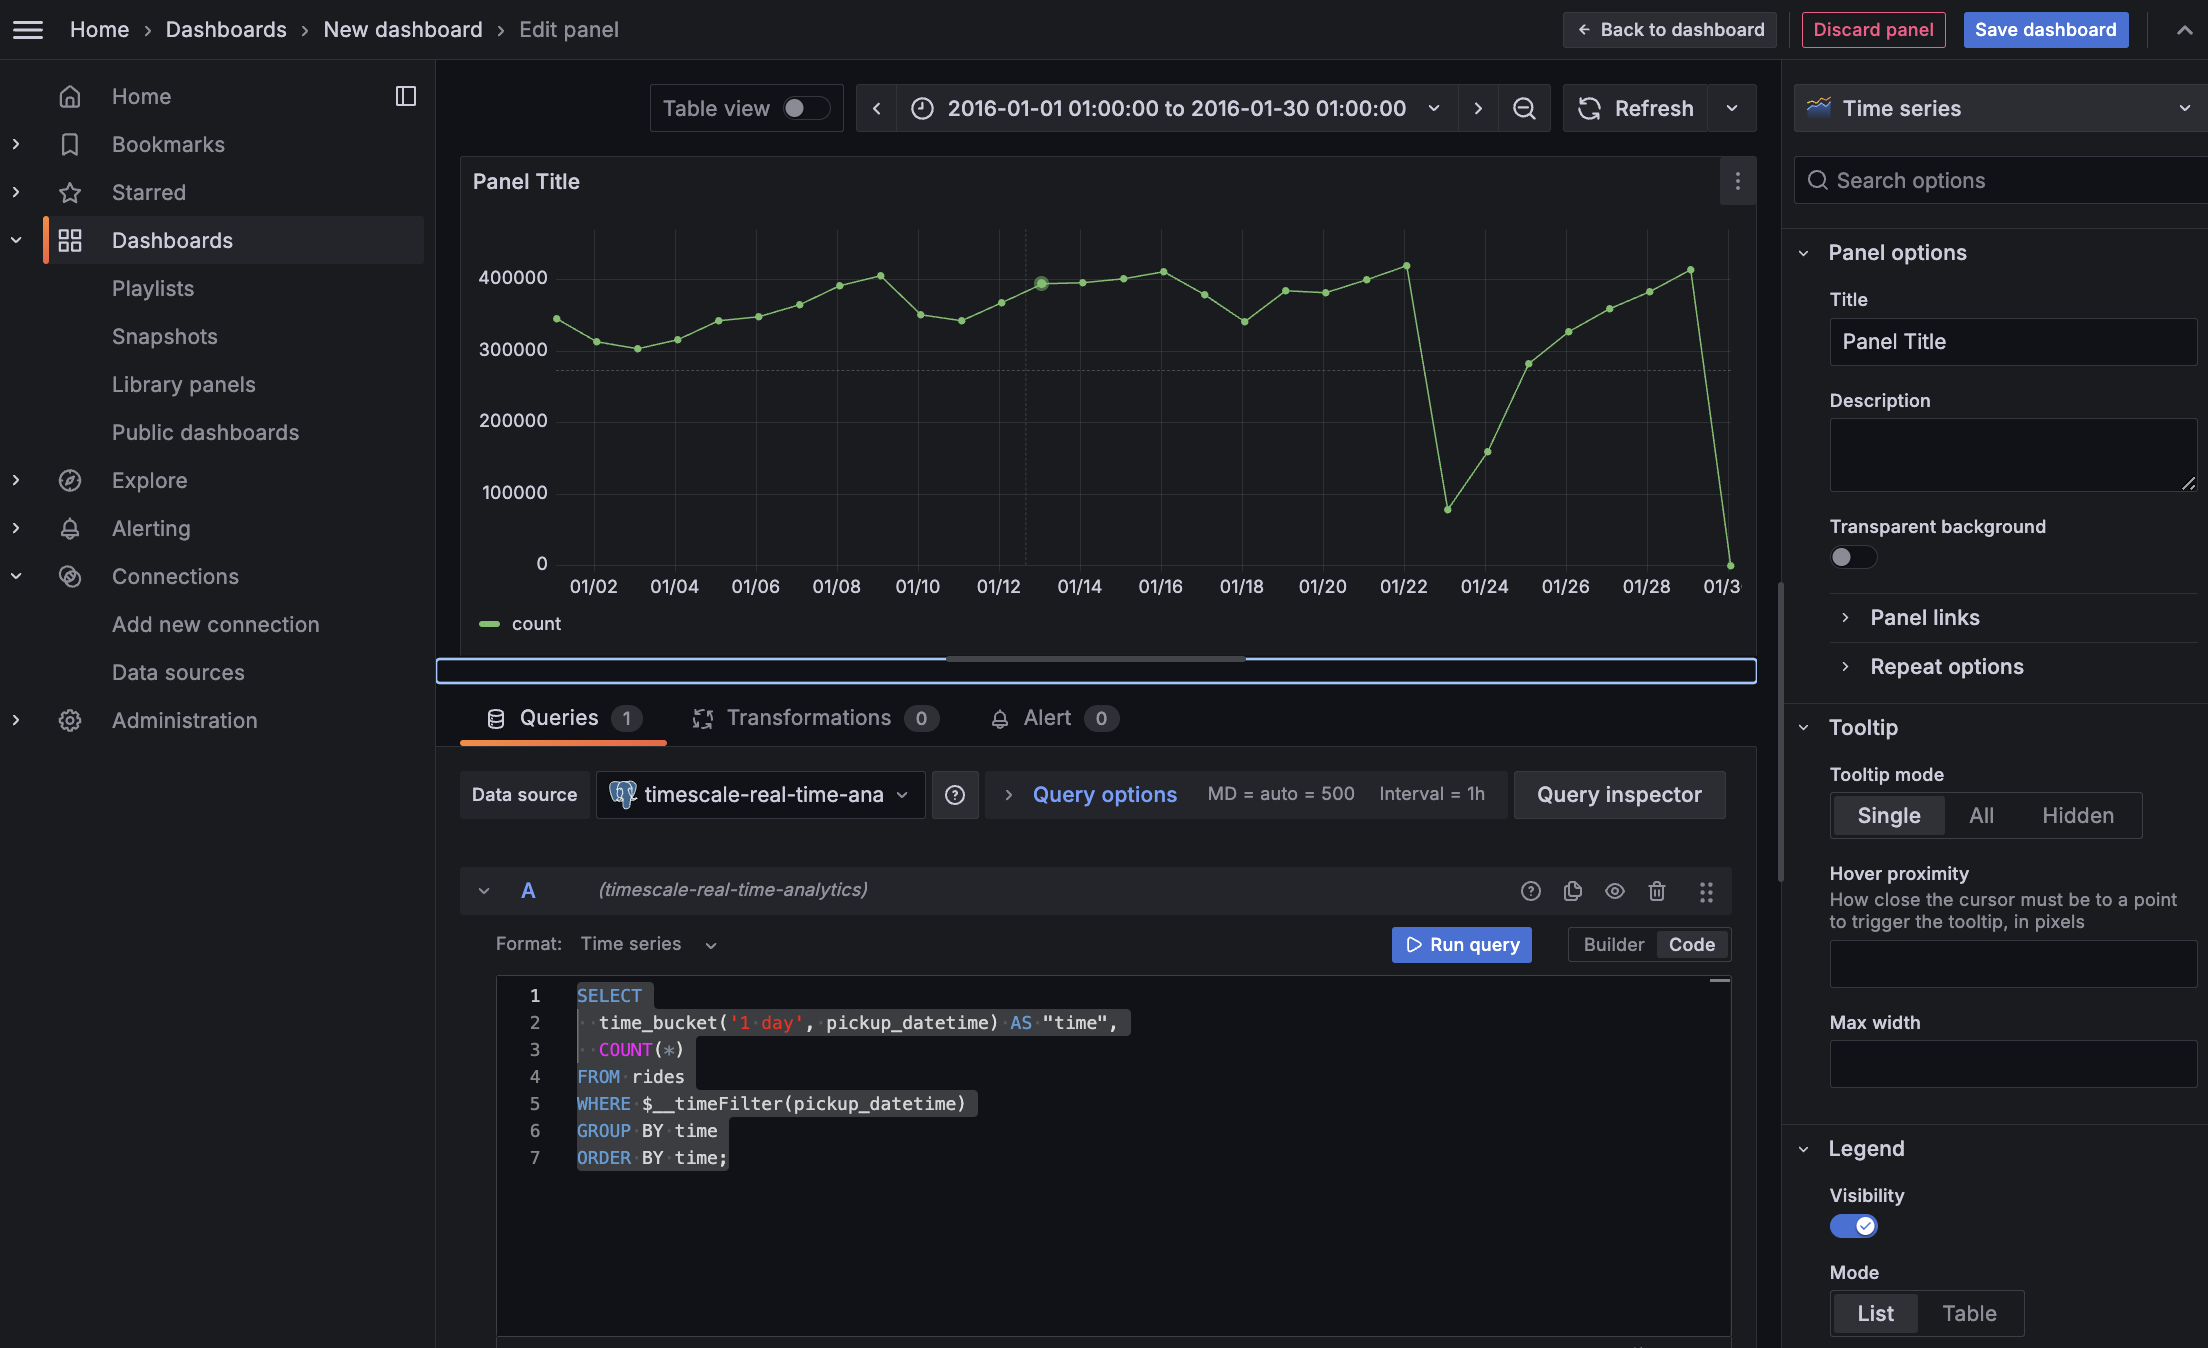
Combine a TimescaleDB [time_bucket][use-time-buckets], with the Grafana _timefilter() function to set the pickup_datetime column as the filtering range for your visualizations.
This query groups the results by day and orders them by time.
- Click
Save dashboard