Visualize energy consumption
A Grafana dashboard represents a view into the performance of a system, and each dashboard consists of one or more panels, which represent information about a specific metric related to that system.
To visually monitor the volume of energy consumption over time:
Create the dashboard
On the
Dashboardspage, clickNewand selectNew dashboard.Click
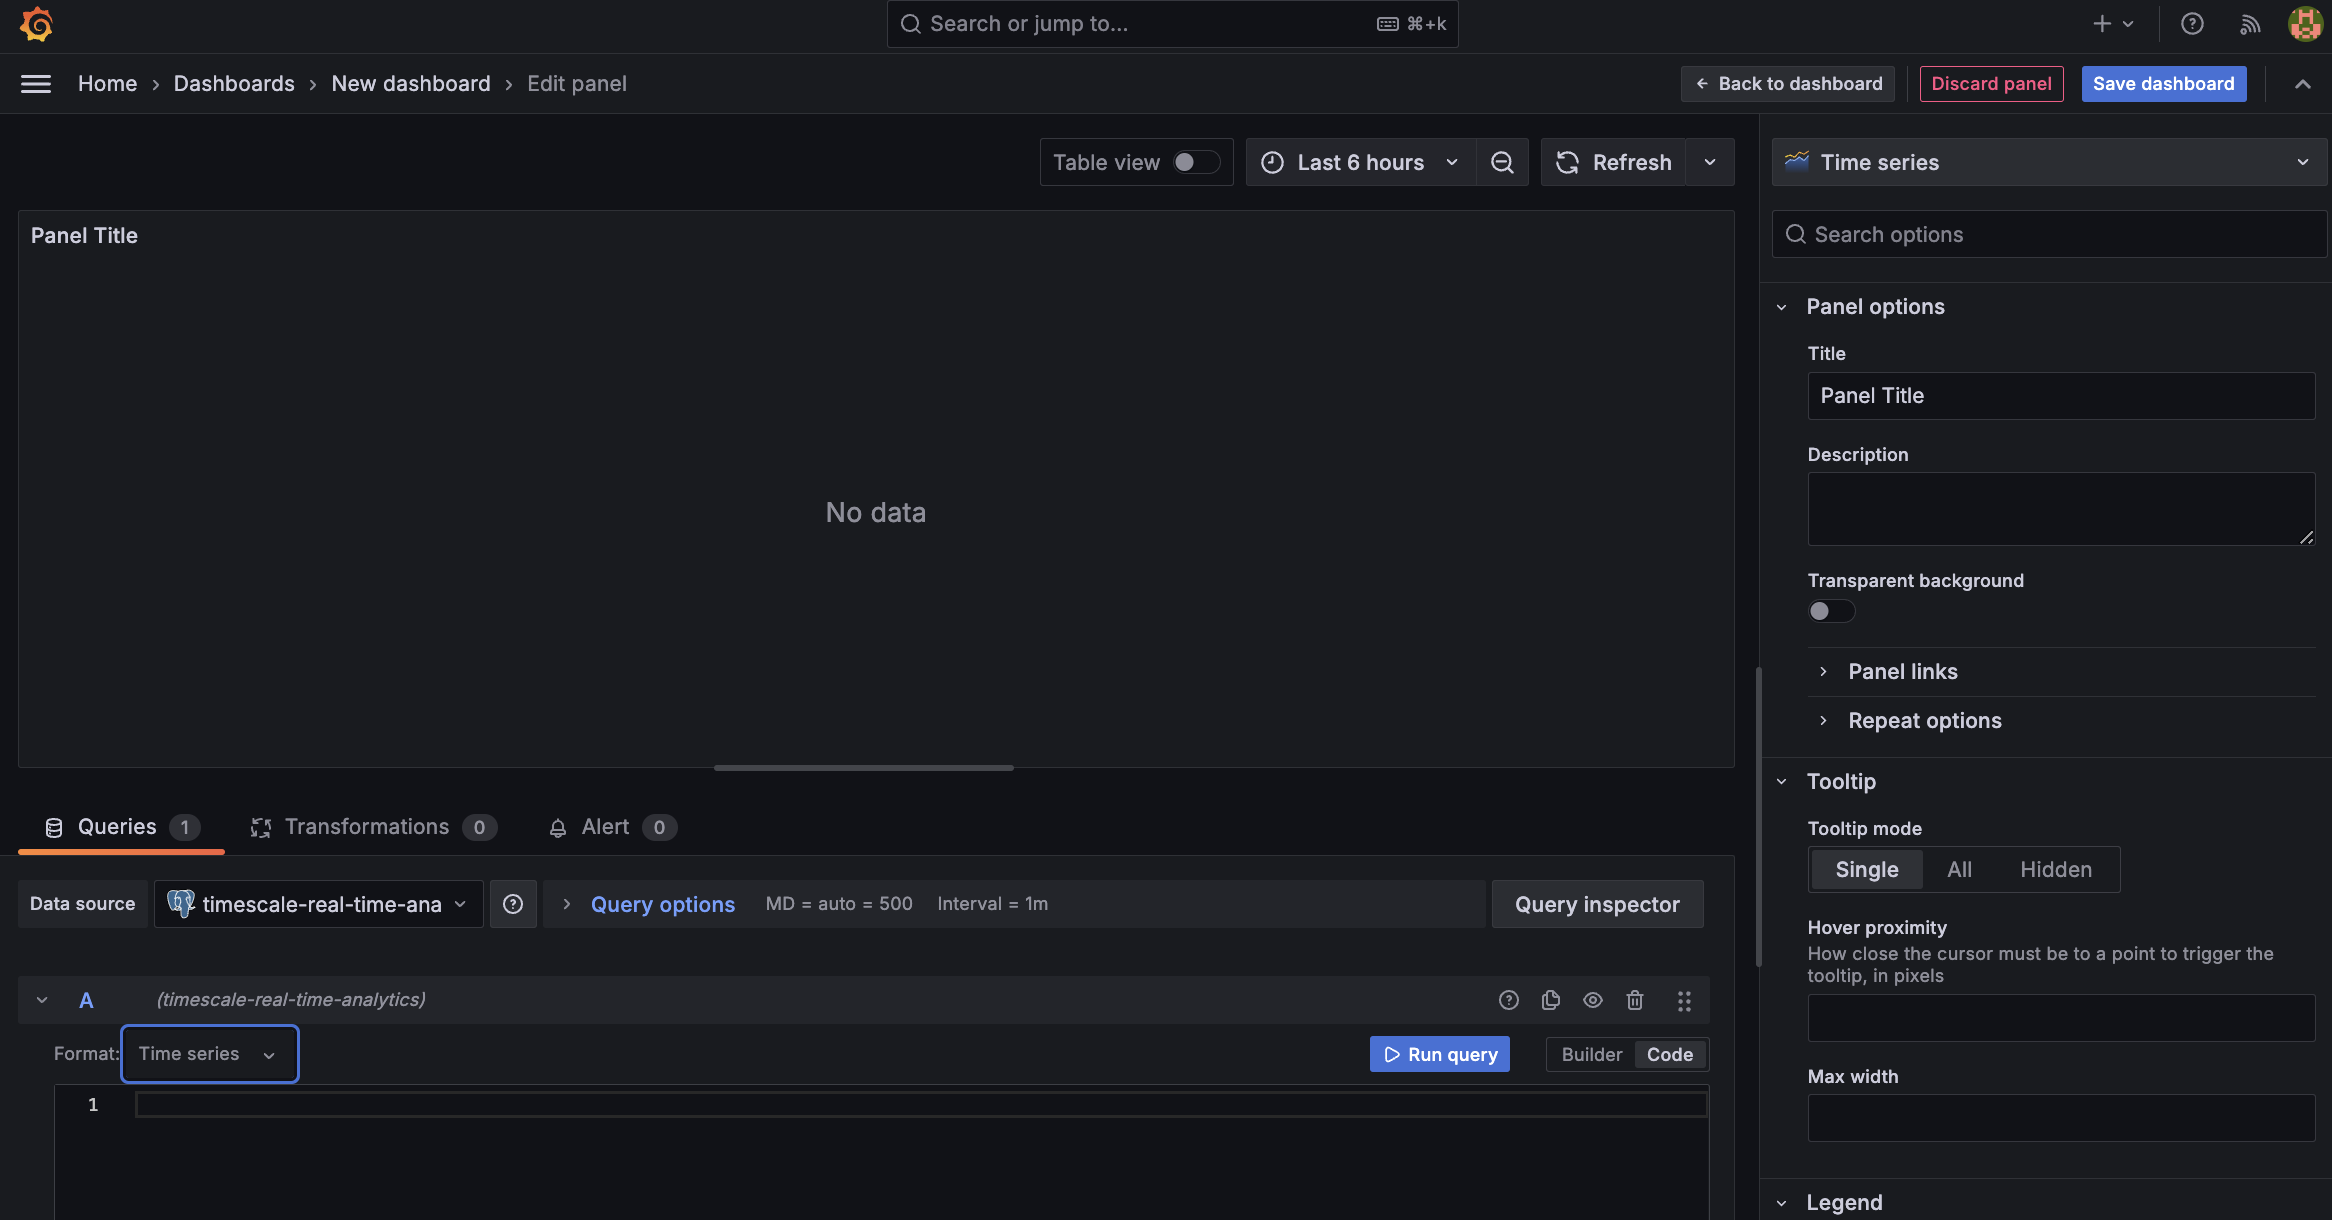
Add visualization, then select the data source that connects to your Tiger Cloud service and theBar chartvisualization.
- In the
Queriessection, selectCode, then run the following query based on your continuous aggregate:
This query averages the results for households in a specific time zone by hour and orders them by time. Because you use a continuous aggregate, this data is always correct in real time.
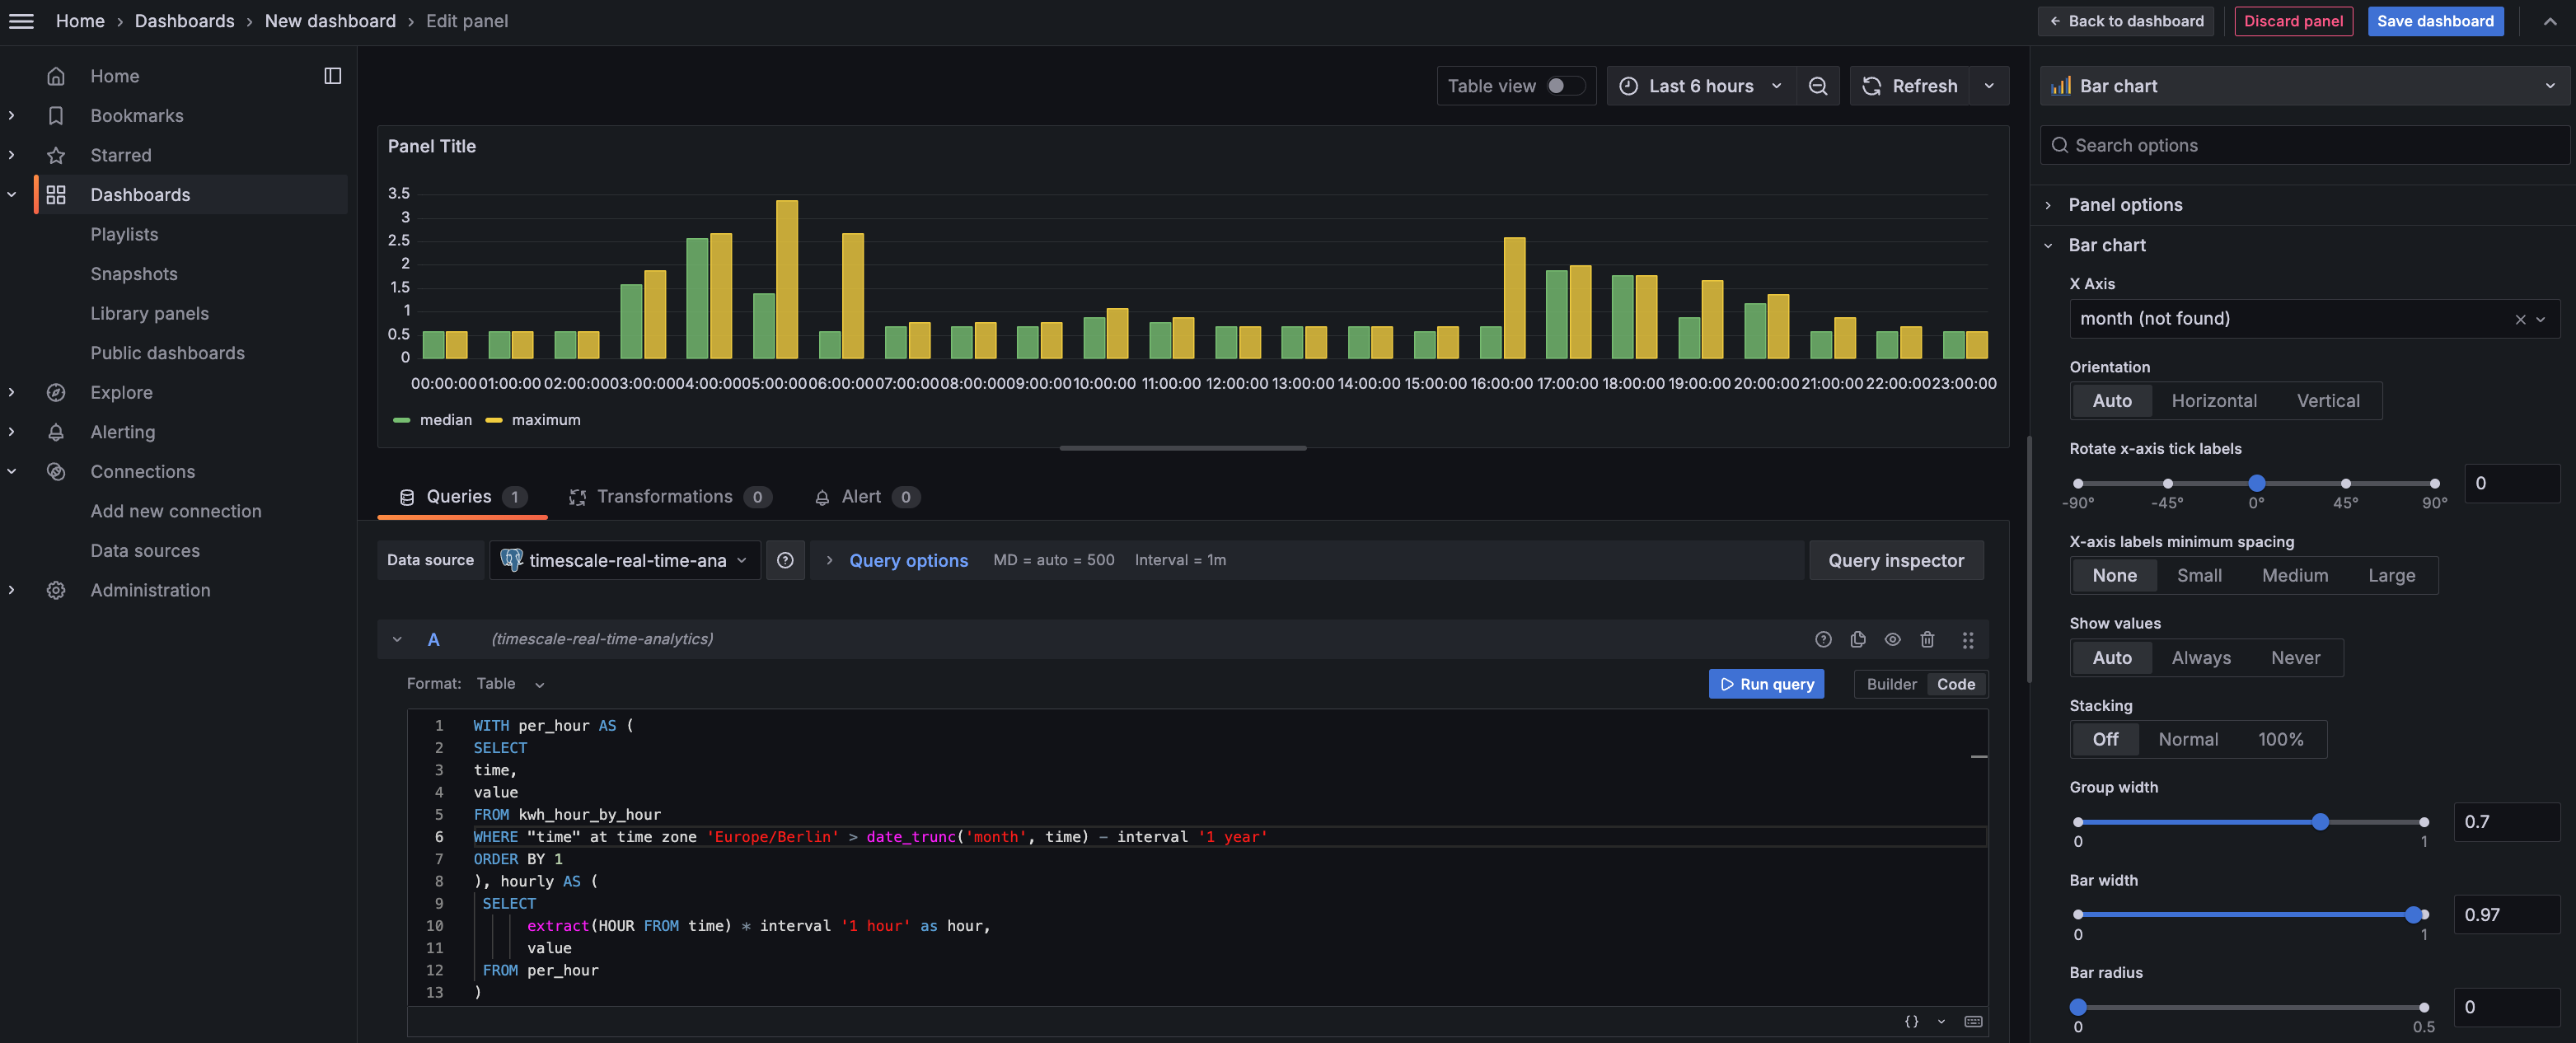
You see that energy consumption is highest in the evening and at breakfast time. You also know that the wind drops off in the evening. This data proves that you need to supply a supplementary power source for peak times, or plan to store energy during the day for peak times.
- Click
Save dashboard
You have integrated Grafana with a Tiger Cloud service and made insights based on visualization of your data.
===== PAGE: https://docs.tigerdata.com/tutorials/simulate-iot-sensor-data/ =====
Examples:
Example 1 (bash):