Export Tiger Cloud service telemetry to Prometheus
To export your data, do the following:
To export metrics from a Tiger Cloud service, you create a dedicated Prometheus exporter in Tiger Cloud Console, attach it to your service, then configure Prometheus to scrape metrics using the exposed URL. The Prometheus exporter exposes the metrics related to the Tiger Cloud service like CPU, memory, and storage. To scrape other metrics, use Postgres Exporter as described for self-hosted TimescaleDB. The Prometheus exporter is available for [Scale and Enterprise][pricing-plan-features] pricing plans.
Create a Prometheus exporter
In [Tiger Cloud Console][open-console], click
Exporters>+ New exporter.Select
Metricsfor data type andPrometheusfor provider.
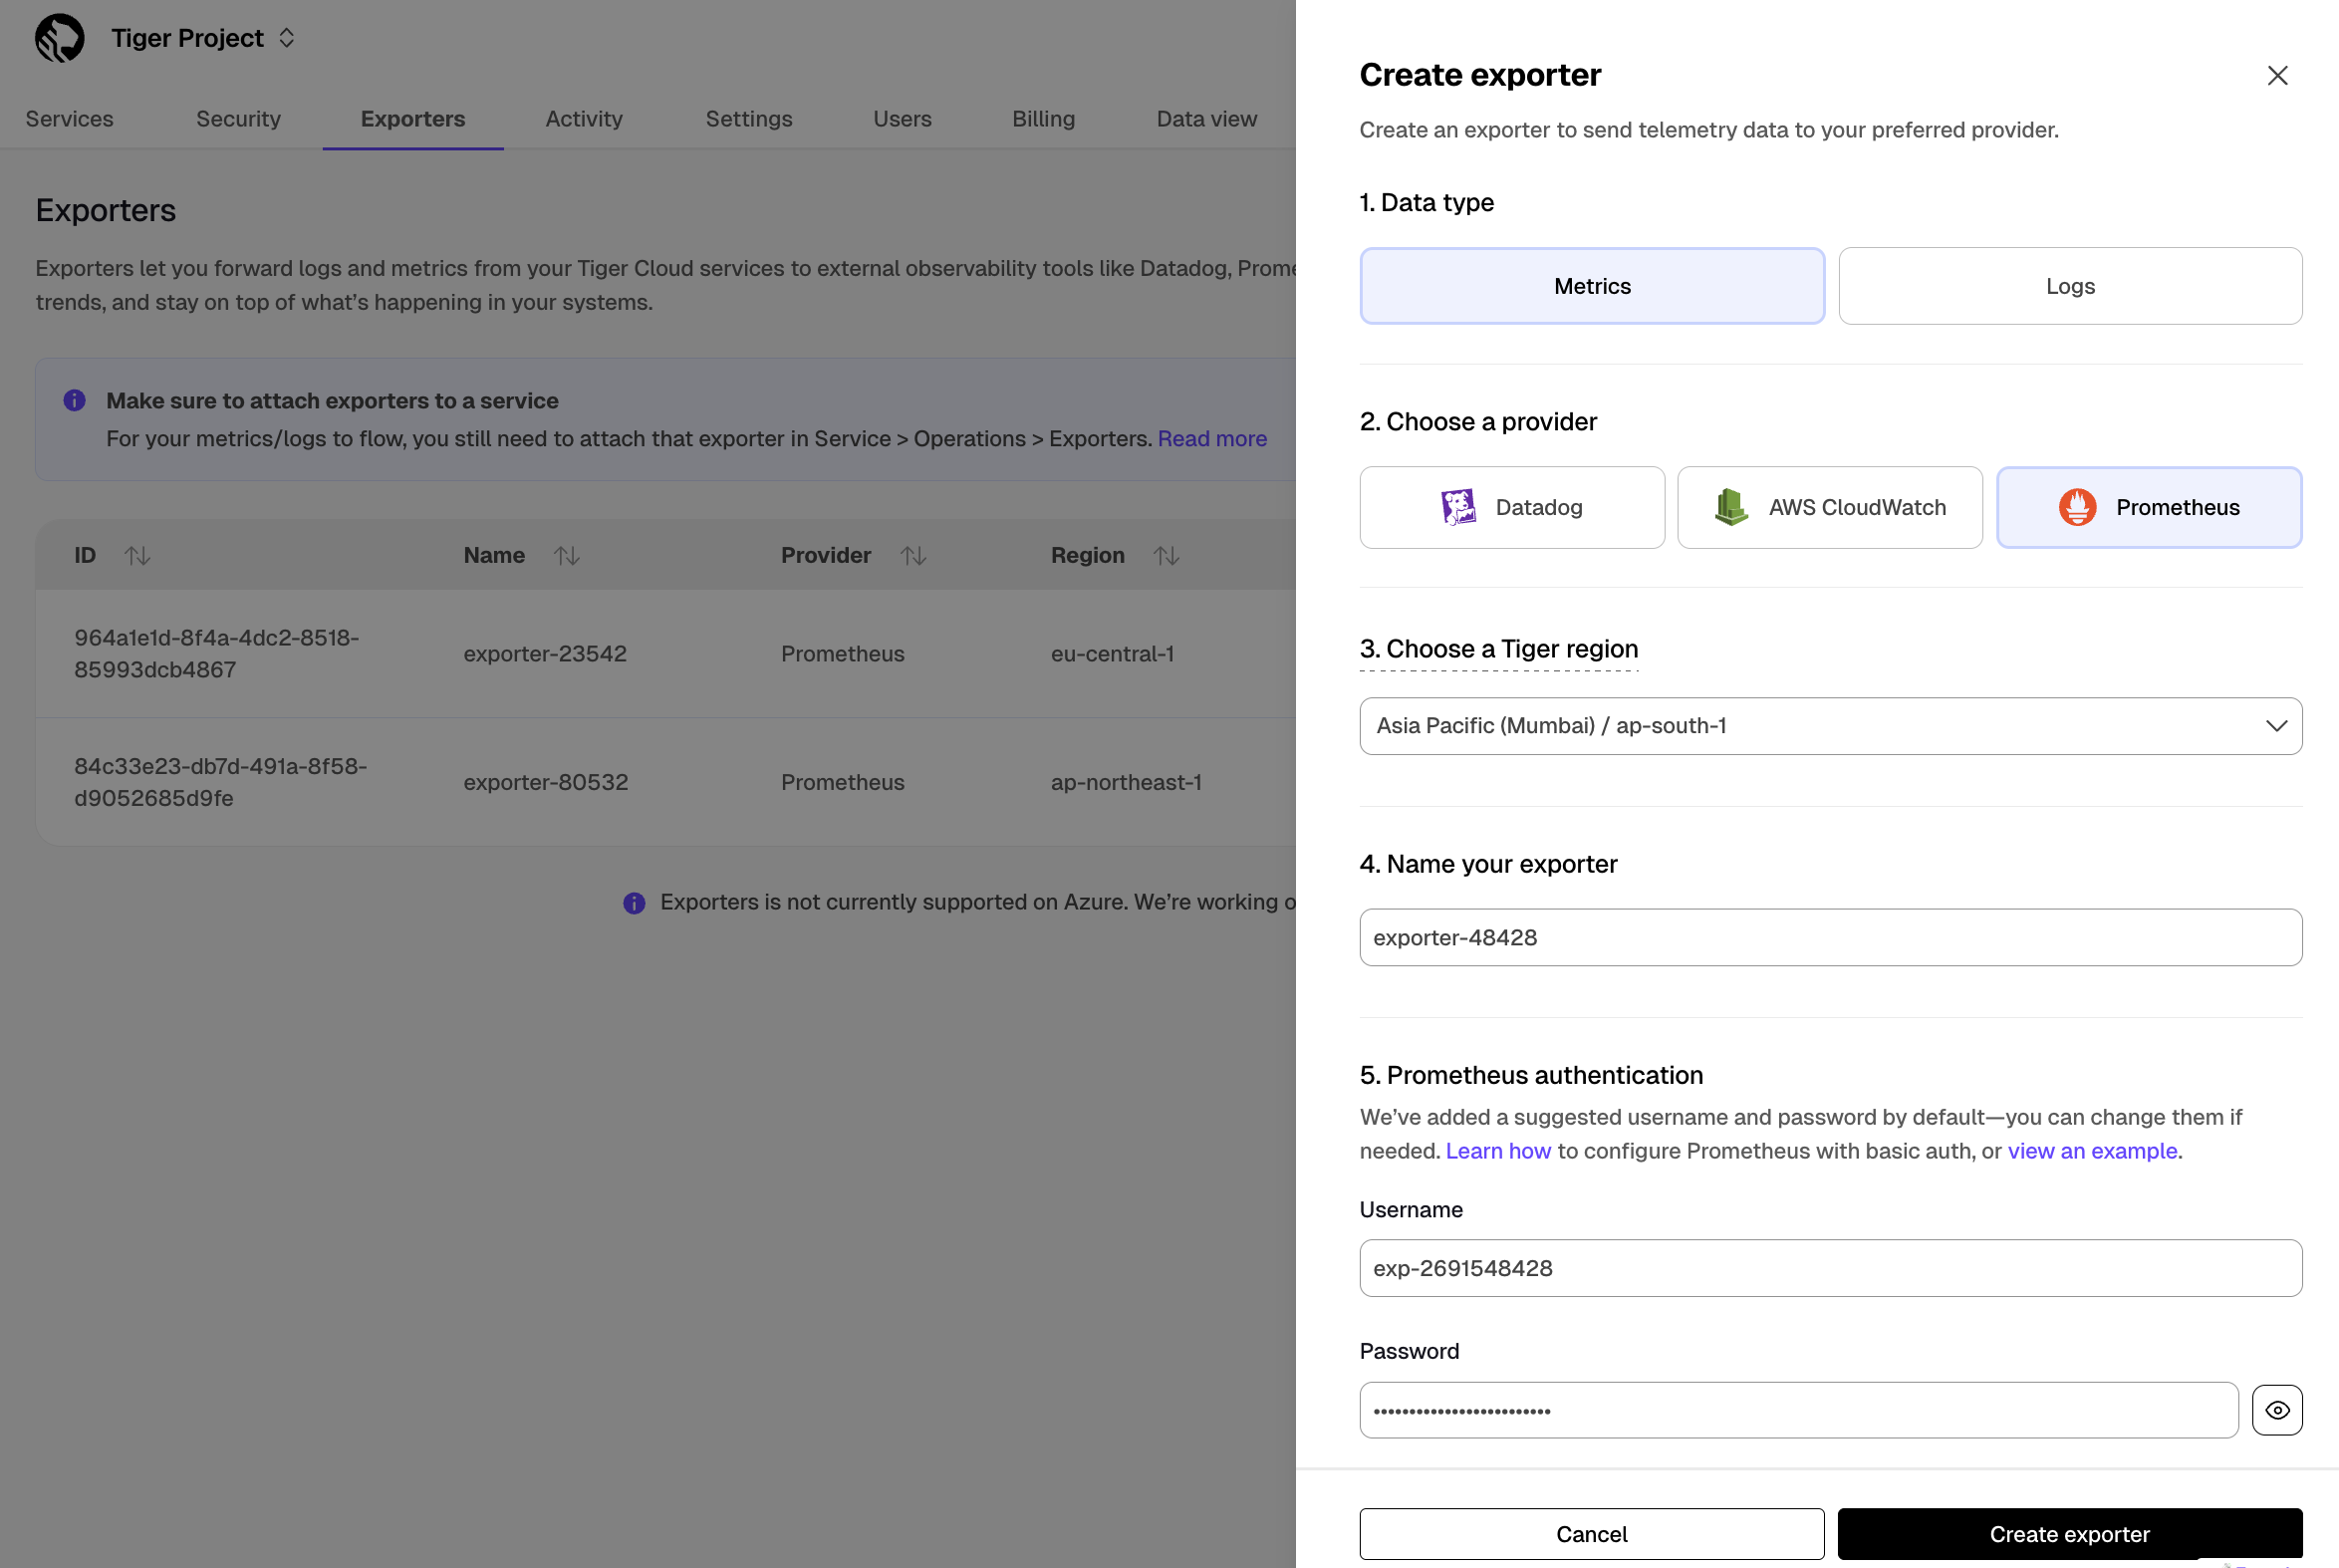
Choose the region for the exporter. Only services in the same project and region can be attached to this exporter.
Name your exporter.
Change the auto-generated Prometheus credentials, if needed. See [official documentation][prometheus-authentication] on basic authentication in Prometheus.
Attach the exporter to a service
Select a service, then click
Operations>Exporters.Select the exporter in the drop-down, then click
Attach exporter.
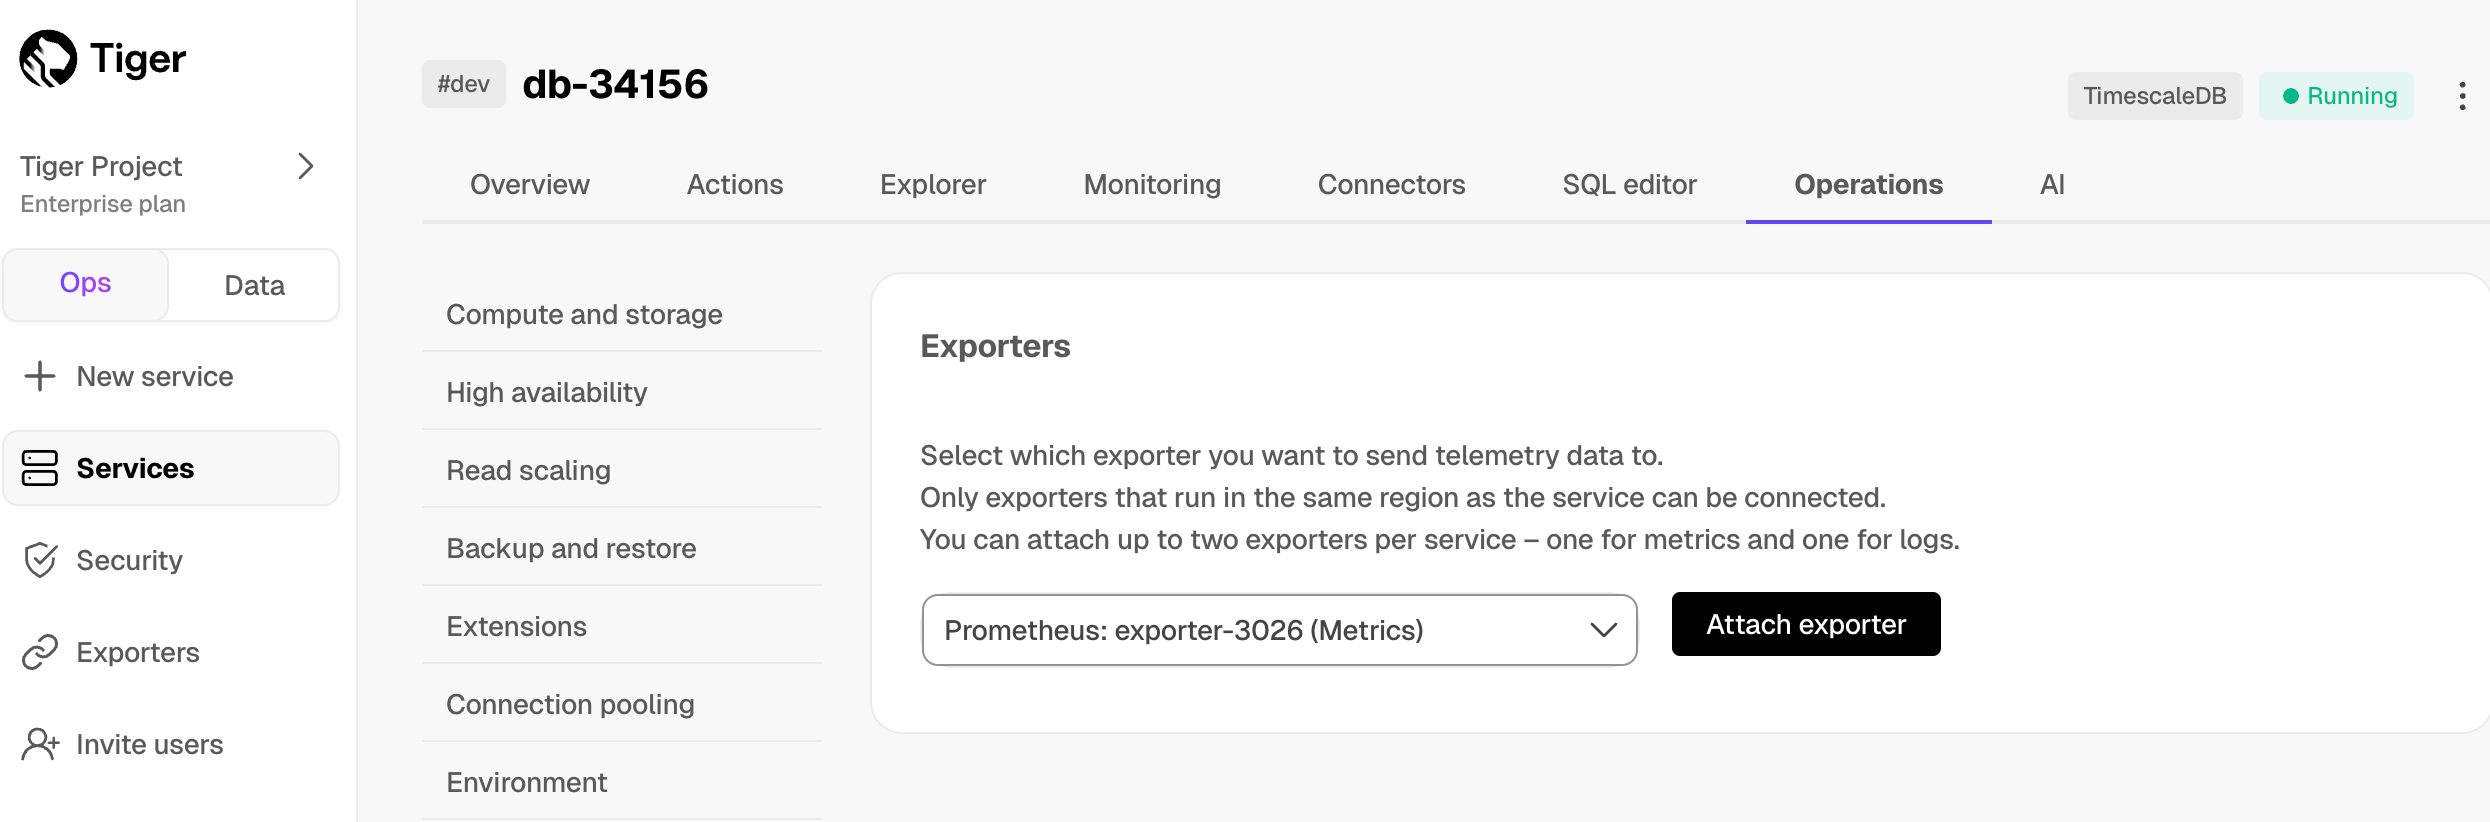
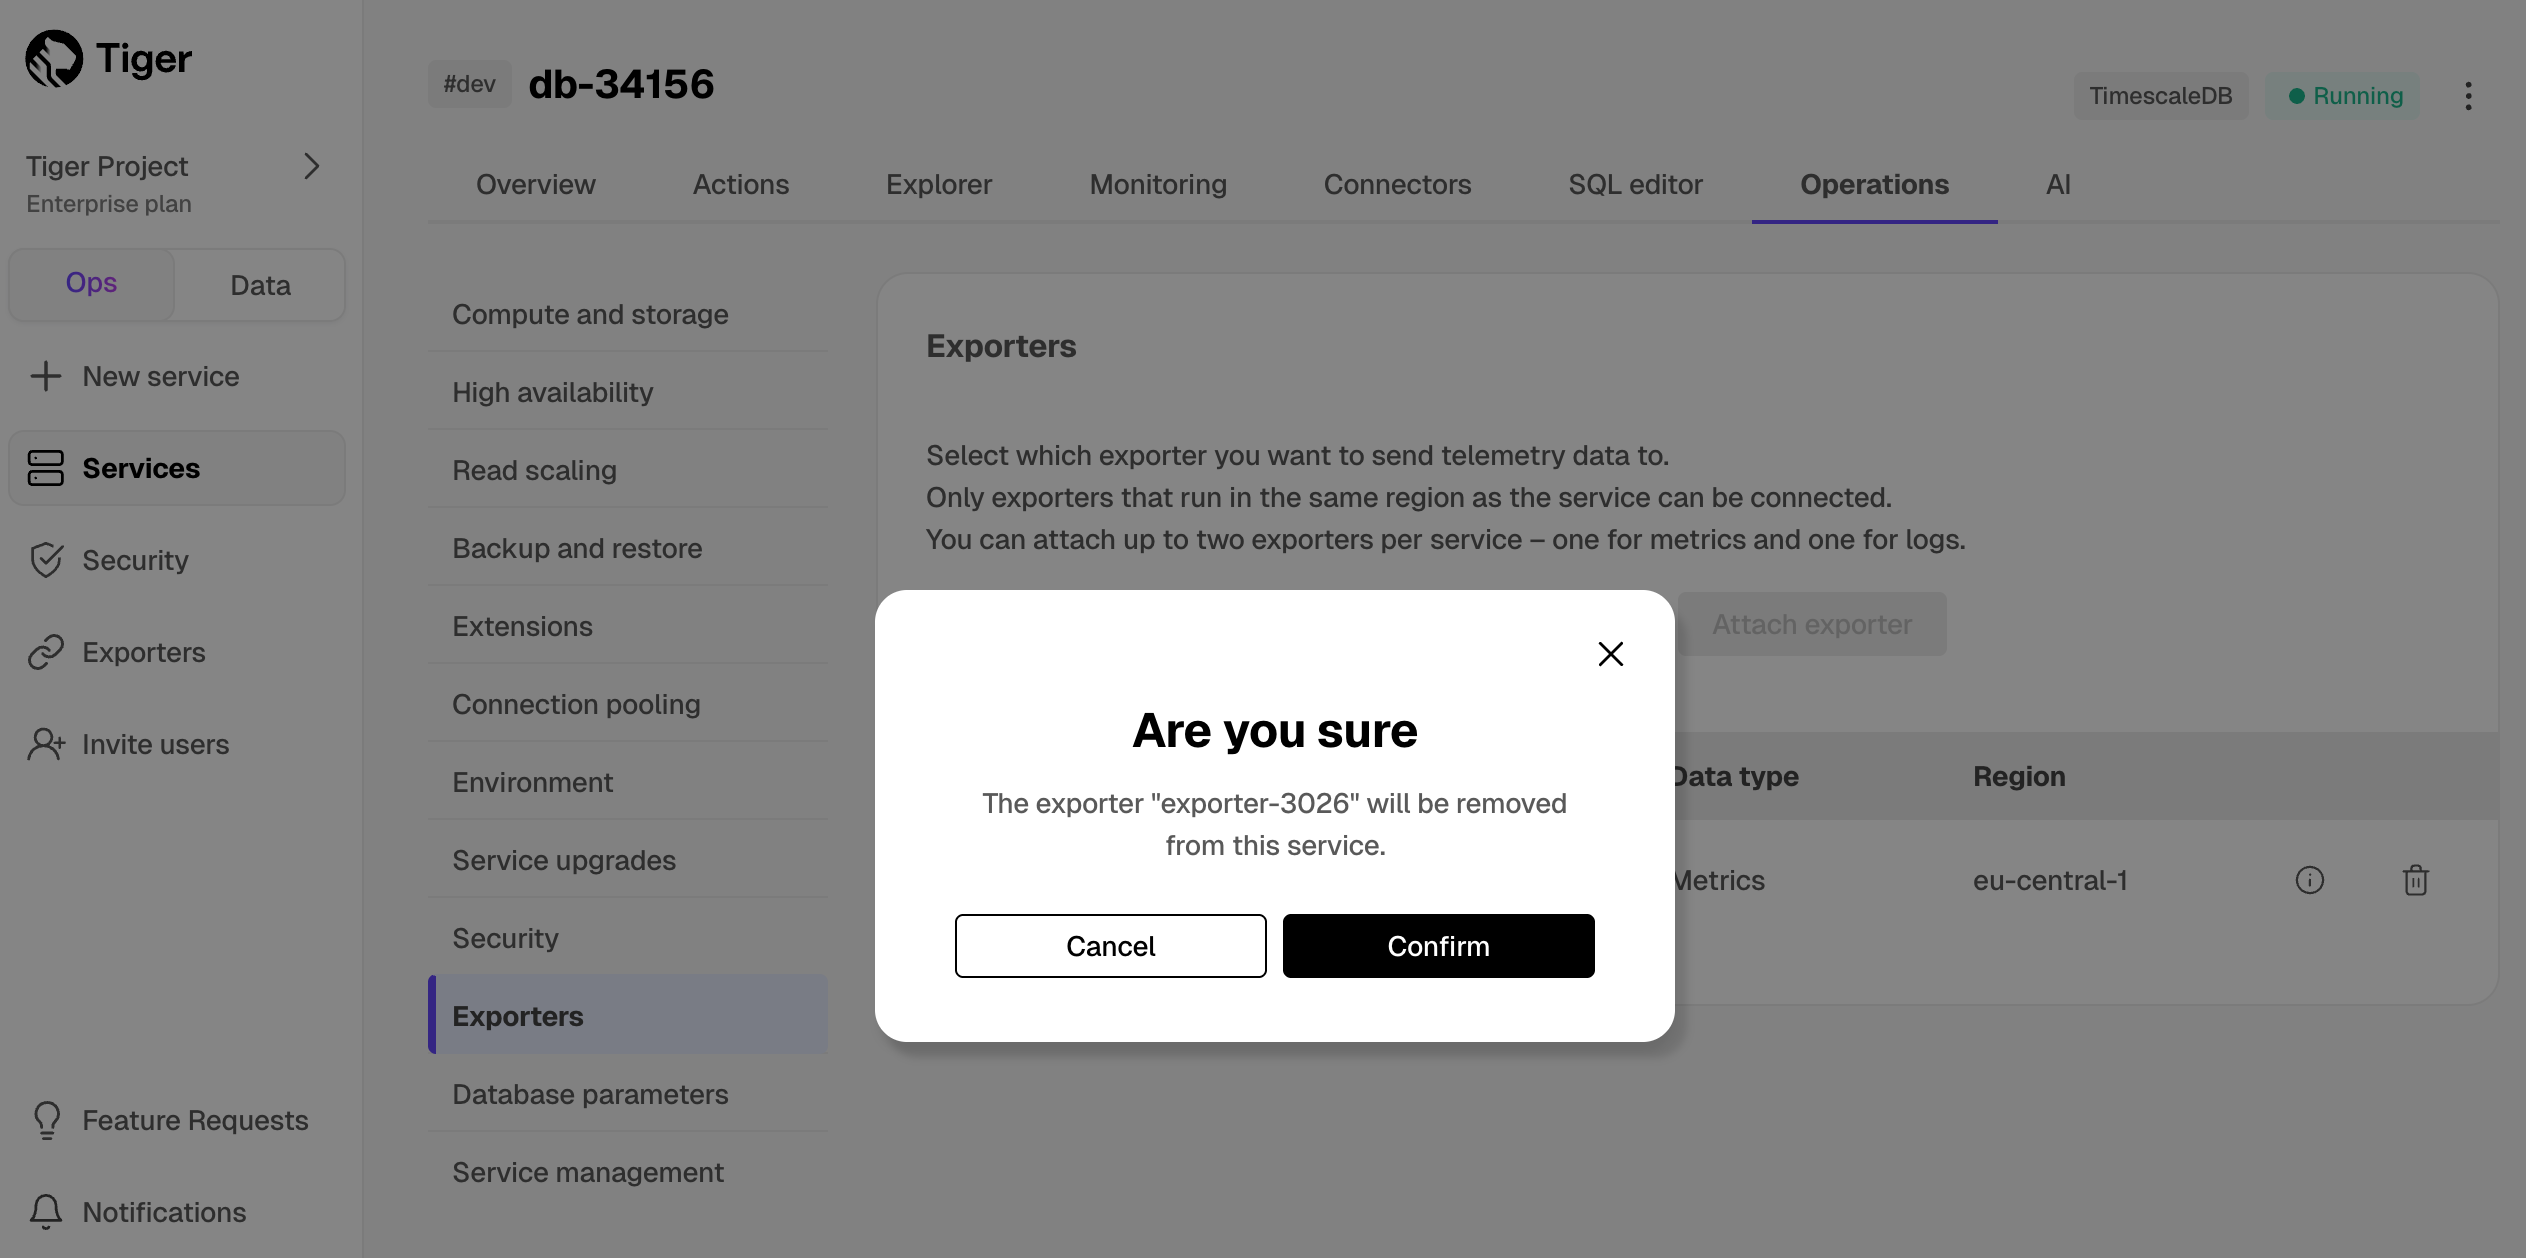
The exporter is now attached to your service. To unattach it, click the trash icon in the exporter list.
Configure the Prometheus scrape target
Select your service, then click
Operations>Exportersand click the information icon next to the exporter. You see the exporter details.
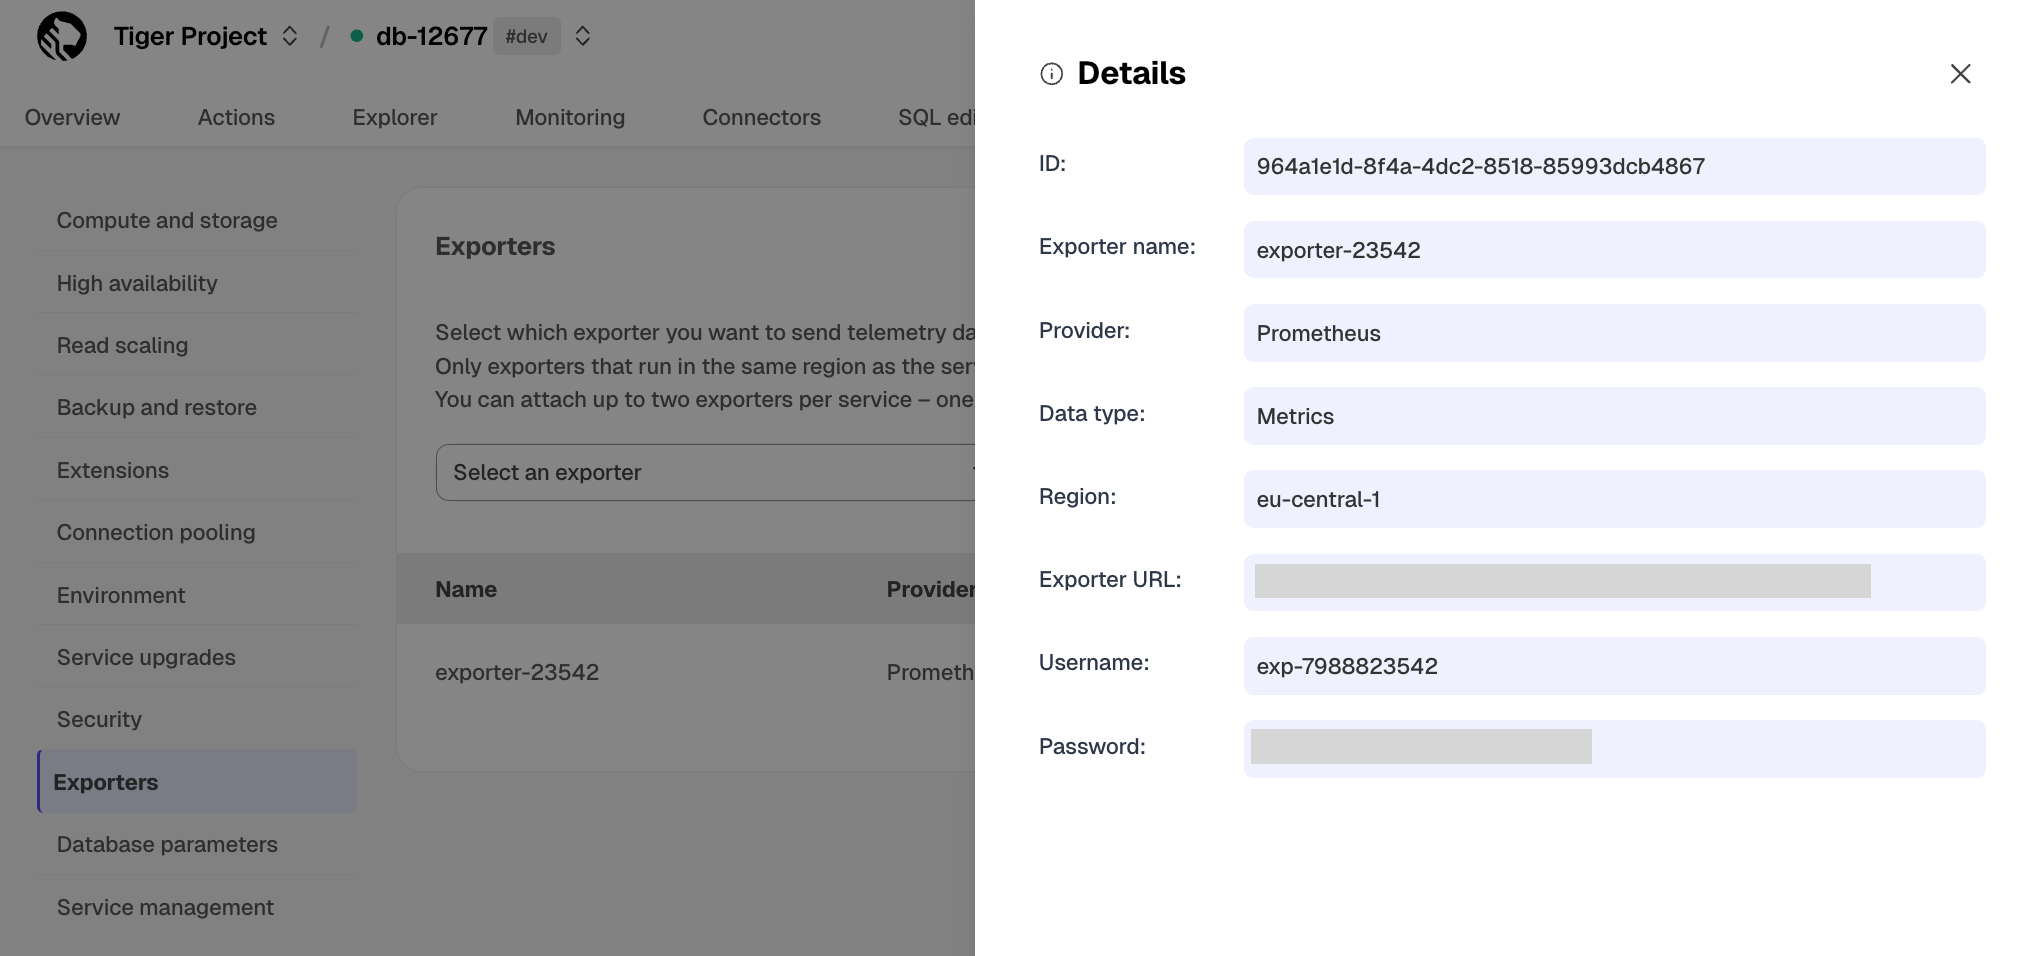
Copy the exporter URL.
In your Prometheus installation, update
prometheus.ymlto point to the exporter URL as a scrape target:
See the [Prometheus documentation][scrape-targets] for details on configuring scrape targets.
You can now monitor your service metrics. Use the following metrics to check the service is running correctly:
timescale.cloud.system.cpu.usage.millicorestimescale.cloud.system.cpu.total.millicorestimescale.cloud.system.memory.usage.bytestimescale.cloud.system.memory.total.bytestimescale.cloud.system.disk.usage.bytestimescale.cloud.system.disk.total.bytes
Additionally, use the following tags to filter your results.
|Tag|Example variable| Description | |-|-|----------------------------| |host|us-east-1.timescale.cloud| | |project-id|| | |service-id|| | |region|us-east-1| AWS region | |role|replica or primary| For service with replicas |
To export metrics from self-hosted TimescaleDB, you import telemetry data about your database to Postgres Exporter, then configure Prometheus to scrape metrics from it. Postgres Exporter exposes metrics that you define, excluding the system metrics.
Create a user to access telemetry data about your database
Connect to your database in [
psql][psql] using your [connection details][connection-info].Create a user named
monitoringwith a secure password:Grant the
pg_read_all_statspermission to themonitoringuser:Import telemetry data about your database to Postgres Exporter
Connect Postgres Exporter to your database:
Use your [connection details][connection-info] to import telemetry data about your database. You connect as the monitoring user:
Local installation:
- Docker:
- Check the metrics for your database in the Prometheus format: