Sizing Self-Hosted Inference for a Team
Everything above sizes hardware for one workload on one machine. A different question comes up whenever a company evaluates self-hosting to serve many developers running coding agents concurrently: how many concurrent sessions can a given GPU configuration actually carry, and does the math beat a per-seat subscription at that headcount? For context on the subscription side of that comparison, see Subscription Strategy at Team Scale.
Concurrency, not single-stream speed, is what a shared deployment needs. A single interactive user rarely saturates a GPU; the economics of shared inference come from serving many requests in the same batch. The GeneralCompute rows below used vLLM 0.8.x, FP8 Llama 3.1 models, prefix caching, 1,024-token inputs, 256-token outputs, and on-demand H100s priced at $2.99/hour. The 671B row comes from a separate 4-bit, 8xH100 analysis. These are different workloads, not one comparable leaderboard. Sources: GeneralCompute methodology and Developers Digest break-even analysis, verified 2026-08-30.
| Model | Hardware | Concurrency | Aggregate throughput | Per-request throughput | P99 TTFT |
|---|---|---|---|---|---|
| Llama 8B | 1x H100 | 64 | n/a | 48 tok/s | 890 ms |
| Llama 8B | 1x H100 | 256 | ≈11,200 tok/s | n/a | n/a |
| Llama 70B | 4x H100 | 64 | n/a | 22 tok/s | 2,400 ms |
| Llama 70B | 4x H100 | 256 | ≈3,400 tok/s | n/a | n/a |
| 671B MoE (DeepSeek-class), 4-bit | 8x H100 | ~100 | ≈620 tok/s | ≈33 tok/s (single-stream) | not reported |
Sources: GeneralCompute vLLM benchmarks for the Llama rows, Developers Digest break-even analysis for the 671B MoE row. GeneralCompute sells the managed service used as the comparison and explicitly discloses that conflict. These are third-party benchmarks on specific hardware and quantization settings, not a guarantee of what any given deployment will reproduce.
Read the per-request throughput column alongside TTFT, not as a substitute for it. A coding agent experiences both the wait for the first token and the time per generated token across a sequence of dependent calls. Neither number says whether an 8B or 70B open model is capable enough for the target coding tasks. The deployment must satisfy a task-success gate and latency objectives before its aggregate throughput can support a business case.
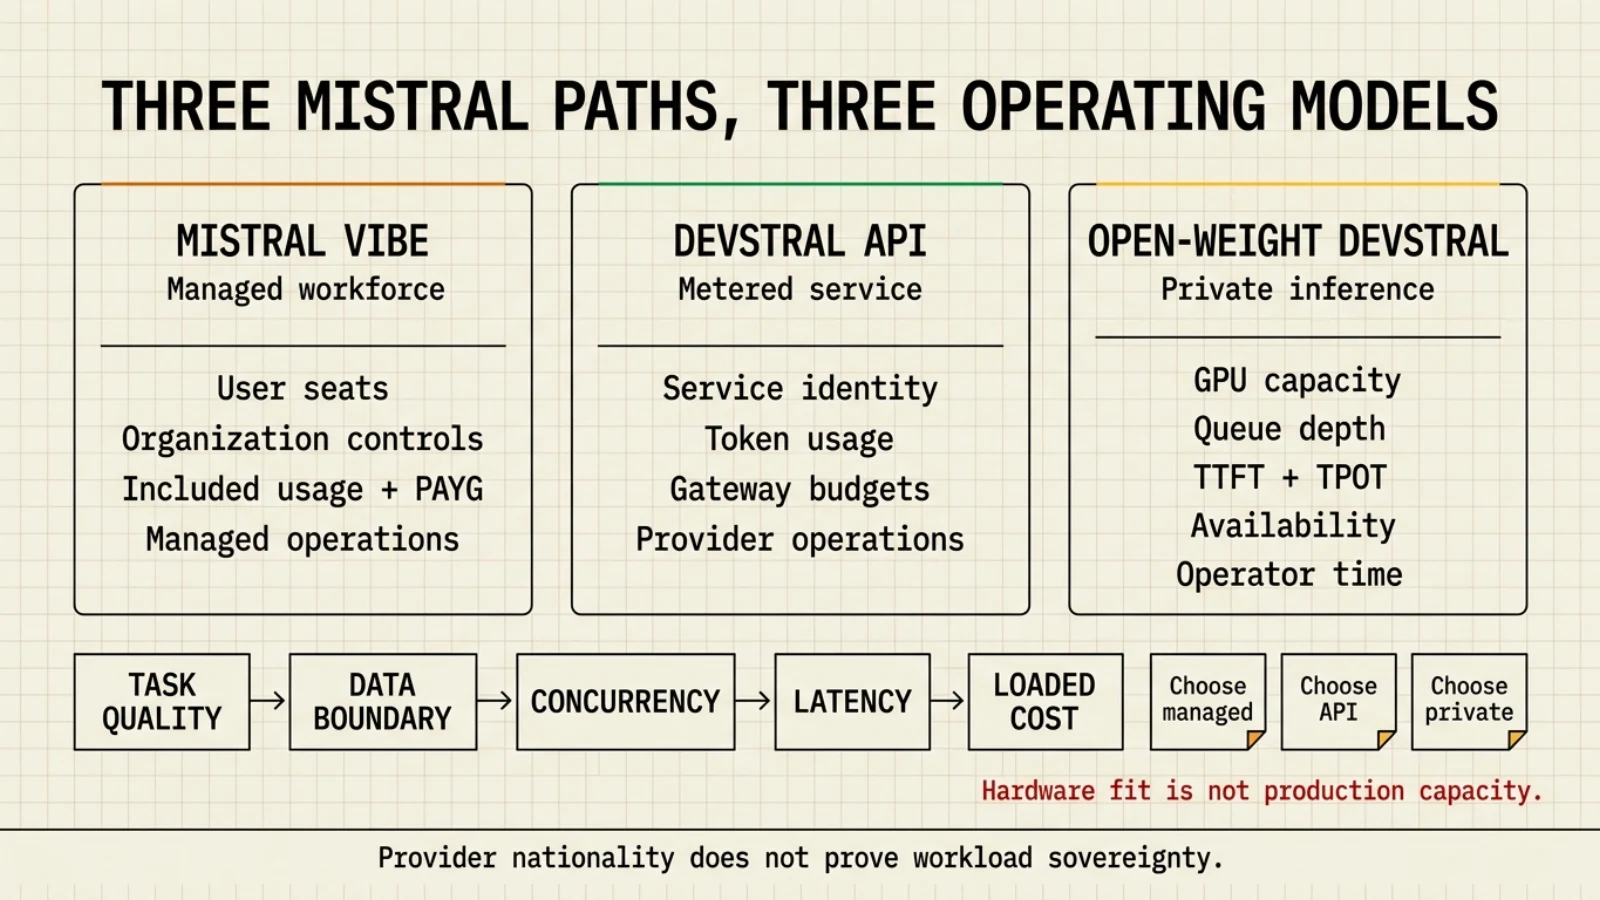
Mistral's Devstral paths have different operating shapes. Vibe is the managed workforce product, Devstral can be consumed through Mistral's API, and the open-weight models can be deployed privately. Mistral's Devstral 2 launch guidance recommends at least four H100-class GPUs for the larger model, while Devstral Small 2 targets a single GPU and can run on some consumer systems or CPU-only configurations. That is a model-fit starting point, not a concurrency result for a development organization. The smaller deployment must still clear the same coding-task quality gate, and the four-H100 deployment still needs measured batching, latency, availability, and loaded operations cost. Sources: Mistral, Devstral 2 and Vibe CLI and Mistral Vibe 2.0, verified 2026-08-31. Compare the three Mistral purchasing paths in the 300-engineer provider exercise.
The January 2026 launch price listed Devstral 2 at $0.40 per million input tokens and $2.00 per million output tokens, and Devstral Small 2 at $0.10 and $0.30. Record those as a dated launch snapshot, not a current quote. Before calculating break-even, recheck the active model identifier, license, API rate, regional processing path, and private-deployment contract. A French provider and EU-default hosting do not establish that every optional feature or subprocessor remains inside France or the EU; the subscription exercise carries that control test.
The break-even math, worked through for one frontier-scale case. The Developers Digest analysis models a 671B-parameter MoE model (DeepSeek-class) rented as an 8xH100 node at an all-in fixed cost of about $16,000/month and finds:
| Utilization | Output tokens/month | Cost per 1M output tokens |
|---|---|---|
| 100% | ≈1.6B | ≈$10 |
| 50% | ≈800M | ≈$20 |
| 20% | ≈320M | ≈$50 |
| 5% | ≈80M | ≈$200 |
The source's June 2026 comparison used DeepSeek V4 Pro at $0.87 per 1M output tokens. At that price, ≈$10 self-hosted was correctly more than 11 times the hosted API price. That comparator has moved. DeepSeek now lists V4 Pro output at $1.98 off-peak and $3.96 peak per 1M tokens. Holding the source's self-host estimate fixed produces a current gap of about 5.1 times off-peak or 2.5 times peak:
| Hosted comparator | Hosted output price / 1M tokens | ≈$10 self-host multiple |
|---|---|---|
| DeepSeek V4 Pro, June 2026 snapshot | $0.87 | >11x |
| DeepSeek V4 Pro, current off-peak | $1.98 | ≈5.1x |
| DeepSeek V4 Pro, current peak | $3.96 | ≈2.5x |
Sources: Developers Digest June break-even analysis and DeepSeek Models and Pricing, verified 2026-08-30. DeepSeek states that prices may change, so the business case must record the comparison date rather than carry one multiple forward indefinitely.
The Developers Digest source says this deployment pencils out only when sustained volume fills the batch, the API being replaced is premium-priced rather than a cheap open-weight host, and operations cost is amortized across that volume. Its closing rule of thumb is roughly 50 to 100 concurrent requests in flight most of the time. Keep that threshold scoped to this 671B-class, 4-bit, 8xH100 scenario.
Ops cost is not optional overhead, it is a line in the same comparison. The same analysis adds $5,000 to $15,000/month of loaded engineer time for running the deployment (capacity planning, upgrades, incident response), on top of GPU rental or purchase. A break-even calculation that stops at GPU-hours understates the real cost by that amount.
Published serving research shows why one concurrency threshold is not portable. The vLLM paper reports 2 to 4 times higher throughput than its evaluated baselines at the same latency and says the improvement grows with longer sequences, larger models, and more complex decoding. Its evaluation used synthetic arrival processes derived from ShareGPT and Alpaca rather than coding-agent production traffic. DistServe measures goodput, the request rate that stays within TTFT and time-per-output-token objectives, and reports up to 7.4 times more requests or 12.6 times tighter SLOs than its evaluated state of the art. Splitwise reports a phase-split cluster design with 1.4 times higher throughput at 20% lower cost than its baseline. These results use different models, hardware, workloads, and baselines, so none predicts the exact savings for this guide's H100 examples. Together they show that prompt length, output length, latency objectives, and serving topology can move capacity and cost materially. Sources: Kwon et al., PagedAttention and vLLM, PDF pp. 1-2 and Section 6, pp. 9-12; Zhong et al., DistServe, OSDI 2024 proceedings pp. 193-194 and Section 6, pp. 201-205; and Patel et al., Splitwise, PDF pp. 1-2 and evaluation pp. 8-12.
Agent workloads make scheduler choice another sizing variable. Agentix, published at NSDI 2026, schedules dependent LLM calls as programs rather than independent requests. Across ShareGPT, BFCL, LATS, and a mixed workload, it reported 4 to 15 times the program throughput of vLLM at the same program-level token latency. The evaluation used Poisson arrivals synthesized from benchmark programs, one homogeneous node with eight A100-SXM4-80GB GPUs, and vLLM 0.6.1. It reported no coding-task quality or cost comparison. The result shows that a request-level vLLM benchmark may misstate agent capacity; it does not supply a production multiplier or a GPU count for 300 engineers. Source: Luo et al., Agentix, NSDI 2026 proceedings pp. 2451-2454, Sections 6.1-6.4 and Figures 11-18.
Commodity networking is a real counterexample to assuming that serving gains require a premium fabric. EcoServe, published at OSDI 2026, evaluated Llama-30B, CodeLlama2-34B, and Qwen2-72B across L20, A800, and H100 clusters. Its primary L20 cluster used 10 Gbps Ethernet, and its 32-GPU result reported goodput improvements of 1.96 to 2.51 times across four comparisons with vLLM, Sarathi, DistServe, and MoonCake. The detailed evaluation reports different margins by model, SLO, and cluster; it also notes that the evaluated DistServe prototype was unmaintained and that some baseline cases could not meet the target SLO. The result is evidence that architecture can change the crossover on commodity infrastructure, not a transferable multiplier. Source: Du et al., Efficient LLM Serving on Commodity GPU Clusters, OSDI 2026 proceedings pp. 1787-1790 and Section 4, pp. 1794-1799.
ThunderServe supplies a second hardware and network counterexample. Its MLSys 2025 evaluation served LLaMA-30B on 32 heterogeneous cloud GPUs and reported up to 2.1 times, with a 1.7 times average, higher throughput than its same-budget baselines. In a separate 4xA40 plus 4xRTX 3090 Ti test, the non-disaggregated baseline delivered 1,610 tokens/s, ThunderServe delivered 3,292 tokens/s over 40 Gbps, and its 5 Gbps placement still delivered 2,196 tokens/s. The 4-bit result compresses KV-cache transfers, not model weights. Prices came from a dated Vast.ai snapshot, arrivals replayed Azure coding and conversation traces through a Poisson process, and the paper did not test coding-task quality, redundancy, or operator labor. This moves a hardware crossover under the tested workload but does not establish economic parity with a frontier hosted model. Source: Jiang et al., ThunderServe, PDF pp. 8-10 and 16-17, Figures 7-12 and 16, and Tables 5-8.
Energy savings do not translate directly into equal cost savings. DynamoLLM's HPCA 2025 evaluation reported 57%, 42%, and 15% lower energy than its SinglePool baseline under synthetic low, medium, and high loads. In a week-long simulation driven by production conversation and coding traces, the average server count fell from 40 to 24.6, saving a modeled $1,362.70 per hour in GPU rental while the associated electricity saving was only $4.40 per hour. The study models serving infrastructure and excludes operator labor. It supports load-aware elasticity and shows that idle GPU rent can dominate electricity, but its H100 trace simulation is not a self-hosting quote for one development team. Source: Stojkovic et al., DynamoLLM, PDF pp. 10-11, Figures 13-17.
Long-running production evidence supports tracing demand before buying hardware. OpenTela is an OSDI 2026 operational-systems paper about a heterogeneous, multi-institution research service, not a coding-agent cost study. Its deployment nevertheless provides a stronger workload witness than a synthetic benchmark: more than 22 months, 13 million requests, 15 billion tokens, 142 models, and over 1,000 researchers, with an anonymized trace covering July 2024 through October 2025. The system needed authentication, usage tracking, routing, service discovery, health monitoring, load balancing, and node lifecycle management in addition to inference engines. Those functions belong in a self-hosting cost model even when existing HPC capacity makes GPU acquisition look cheap. Source: Yao et al., OpenTela, OSDI 2026 proceedings pp. 1821-1822 and Section 6, pp. 1829-1833.
Coding-agent demand also varies within the same task. A 2026 preprint analyzing trajectories from eight frontier models on SWE-bench Verified found up to 30 times variation in token use across repeated runs of one task, with input tokens driving overall cost and higher token use not implying higher accuracy. A second preprint ran 2,700 trials on five tasks with one model and found that cutting a full specification to a bare user story increased pooled token spend by 29.7%, while identical configurations retained a 1.34 times median run-to-run spread. Both are benchmark studies rather than production telemetry, and the second study's one-model, five-task design is a material limitation. Together they rule out sizing a fleet from seat count, one prompt, or average output tokens alone. Sources: Bai et al., How Do AI Agents Spend Your Money?, PDF pp. 1-6 and 10-12; and Smékal, Can your AI agent be cheaper?, PDF pp. 3-6 and 9-10.
Observed coding-agent traces show which parts of that distribution matter for serving. TraceLab covers 4,265 Claude Code and Codex sessions from 43 developers across eight months. The median step reads 126,180 prefix tokens for Claude or 115,584 for Codex while producing 252 or 184 output tokens, respectively. Its token-weighted prefix cache-hit rate is 95.7%, yet cache misses cause 3.8 times more prefill tokens than genuinely new input alone would require. A separate GitHub Copilot trace covers one week in June 2026, 13.5 million sessions, and 3.2 million US users. It reports a 50 times range in per-turn token consumption across five user archetypes, shallow LLM concurrency among turns that overlap (median 1.15, P90 1.4), and tool failures in 9% of turns that can amplify compute by up to 4 times through retry loops. TraceLab reconstructs cost from API list prices and does not measure task acceptance; the Copilot paper anonymizes models and discloses neither GPU infrastructure nor serving cost. These traces support session-level cache, prefill, failure, and percentile modeling, but neither provides a GPU count or a hosted versus self-hosted break-even. Sources: Zhu et al., TraceLab, PDF pp. 1-6 and 11-13, Tables 1, 5, 8, and 11; and Liu et al., Agentic Coding in the Wild, PDF pp. 1-6 and 15-16, Tables 1, 3, and 7 and Figure 7.
A practitioner experiment shows why the pilot must replay the agent's exact message pattern. In a local coding-agent setup using llama.cpp, the speakers found that a timestamped header changed on every message and invalidated the KV cache. They estimated the resulting performance drop at about 95%. The same talk notes that each concurrent user adds a separate KV cache, but provides no user count, throughput, TTFT, hardware result, or benchmark artifact. Treat the percentage as an incident estimate specific to that integration, not a llama.cpp or vLLM constant. Test stable prefixes, real context lengths, concurrent sessions, cache eviction, TTFT, time per output token, and queue depth before sizing the deployment. Source: Maestri and Soldano, "Running Your Coding Agent Locally", 31:58 and 41:58, Devoxx, published 2026-04-01.
What this means for a 300-engineer organization: do not translate 300 seats into 300 concurrent requests, and do not treat 50 to 100 concurrent requests as a universal break-even. Run a representative pilot and retain the arrival trace, session and turn percentiles, specification variant, thinking effort, prompt and output lengths, cache-hit and eviction behavior, tool-failure and retry rates, simultaneous calls per task, TTFT and time-per-output-token objectives, accepted-task rate, cost per accepted task, and GPU utilization. Include service discovery, routing, monitoring, failover, upgrades, and operator time in the same model. Compare hosted and self-hosted options at the same task-success and latency gates. The 8xH100 case above remains evidence that bursty developer traffic can leave expensive capacity idle, while the systems and operational papers show that workload shape and serving architecture can move the crossover.