Activity Patterns
The Patterns page reveals when, where, and how you work with AI coding assistants.
Work Hours
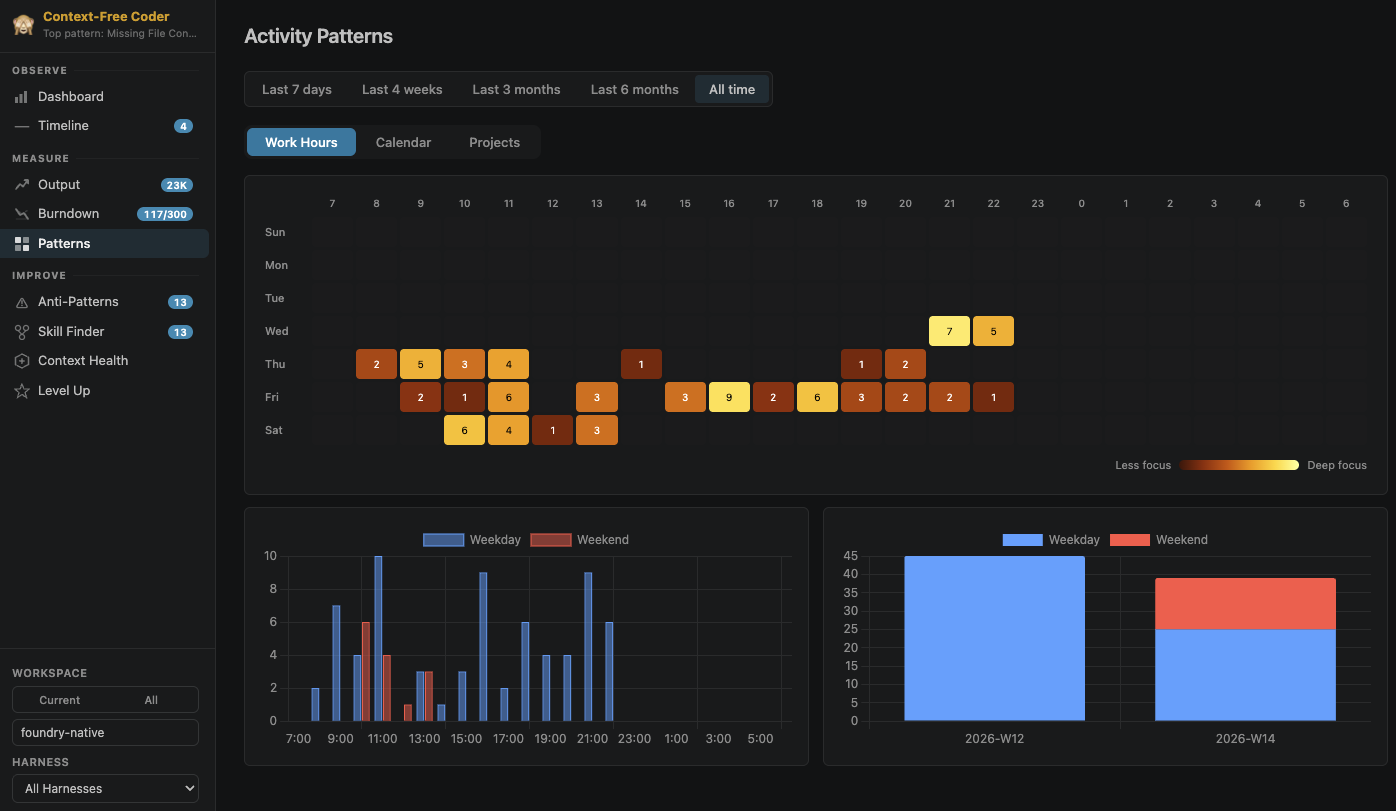
The Work Hours tab shows a heatmap of your coding activity across the week. Each cell represents an hour-long slot on a specific day of the week, and the color intensity indicates how many focused requests you sent during that time.
Below the heatmap, two charts compare weekday vs. weekend activity:
- Hourly distribution -- When during the day you are most active, split by weekday and weekend
- Weekly volume -- Total request counts per week, split by weekday and weekend
These patterns help you identify your peak focus hours and understand your work-life balance with AI tools.
Calendar
The Calendar tab presents a GitHub-style contribution grid. Each day is a cell colored by activity level. This gives you a long-range view of consistency and streaks.
Projects
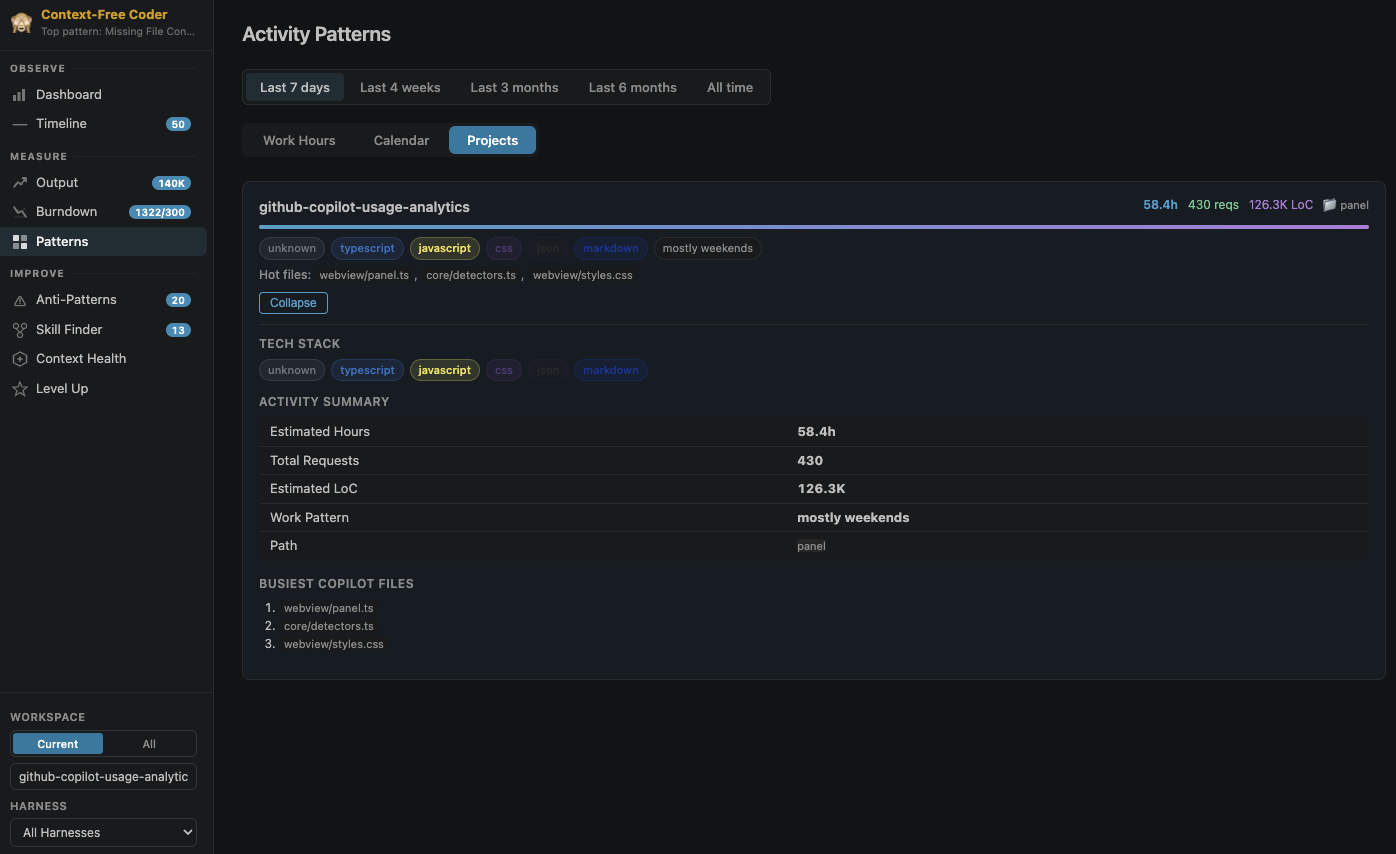
The Projects tab breaks down activity by workspace. For each project, you see:
- Estimated hours of AI-assisted development
- Total requests sent
- Estimated lines of code generated
- Work pattern (e.g., "mostly weekdays", "mostly weekends")
- Tech stack tags detected from the files you worked on
- Hot files -- The files most frequently referenced in AI conversations
- Activity summary table with key metrics
This view is valuable for understanding which projects consume the most AI resources and how your usage patterns differ across codebases.